Supply Chain Management
Introduction
Discerning supply chain management as an exquisite part of stupendous growth is one
of the most paramount realizations that any firm must make. The true question stands,
why exactly do we have to believe that the supply chain management framework
is not secondary to a colossal growth strategy but works simultaneously with the
multitude of strategies that are embedded in the strategic growth framework? To
understand that, lets first understand what a supply chain is exactly:
Definition of Supply Chain
A supply chain is a network of nodes, each that is
assigned a responsibility which chooses itself from procurement, transformation or
transmission of materials and information all the way from the ultimate transmitter
(Raw material supplier) to the ultimate procurer (consumer).
Now that we know what a supply chain is, let us understand the notion of supply
chain management.
Definition of Supply Chain Management
Supply chain management is the art of
aligning the supply chain with respect to a strategy and facilitate point to point
connections between nodes of the supply chain optimally.
What is that strategy? Well, the strategy is the one that belongs to the strategic
growth framework, more specifically, that part of the strategic growth framework
which deals with the marketing framework. This explains why the supply chain
management framework goes hand in hand with many of the strategies that fit in the
strategic growth framework.
If we were to represent supply chain management mathematically, then we would
define it as:
Supply Chain Management = f(Strategy, Optimized Logistics)
Optimized logistics is something that we call logistics that incorporates mathematical concepts to reduce waste. So what is logistics?
Definition of Logistics Management
Logistics management is the art of planning
and delivering a strategy in real-time through facilitating entities befittingly.
The keywords ”delivering” and ”entities” are very very important. By delivering, we
mean, projecting the strategy into reality, and by entities, we mean the participating
nodes in our strategy.
Now that you have a good hold on what supply chain management is, we will
now talk about the history and evolution of supply chain management.
The History of Supply Chain Management
The term supply chain management was first coined by British logistician Keith R
Oliver in an interview in 1983. Although it was Keith who popularized this term, the
concept dates back to 1950's, right after world war 2. There are seven stages with
respect to the evolution of supply chain management:
- Misconception - 1950s
- Fragmentation - 1960s
- Consolidation - 1980s
- Integration - 2000s
- Automation - 2010s
We shall discuss each of these stages in detail.
Misconception
This stage was outright after the world war 2. At this point of time, industrialists
thought that the delivery stage of any product is just packaging and transportation.
So you make a product, pack it and just transport it. Packing is relatively a ”noisy”
concept for the context, i.e. packing protocols are pretty much covered in other areas,
so we will focus more on the transportation aspect.
Transportation is no joke, we can't say that transportation simply means moving
from one place to another. There is one factor that escalates the difficulty of
transportation: ”Optimism”. Firms really need to optimize transportation costs, for
which an enormous use of mathematical concepts is necessary. In this article, we
solve the general transportation problem:
Assume that there are m different ways of transport, t1, . . . , tm, n different destinations d1, . . . , dn and distance D1, . . . ,Dnand a total of T1, . . . , Tn goods to be transported to the n destinations. Using transport ti has cost ci per mile and gi number of goods need to be transported to destination di, while the total capacity that ti can hold is Ci. Find the optimal way of executing this task.
The expressions that we want to minimize are:
where oij is the number of times transport means tj has been used to reach destination di for all i. Another constraint we have for the above expression is that:
for all i because the transportation should be able to deliver all the goods successfully to the respective destinations.
To reduce lead time, the best option is to do all of it simultaneously, because
definitely there will be enough trucks for transportation, and there is no use waiting
for the truck to go and come and send them for delivery again, since the cost is the
same, but the time is getting wasted. So the best solution for lead time reduction is
to simultaneously deliver the goods to all dealers.
Fragmentation & Consolidation
In the 1960s, industrialists realized the need to segregate the delivery of a product into different dimensions, since purely transporting goods from one place to another would turn out to be a total waste if we did not take care of the more important aspects, such as inventory management. At that point, industrialists charted out the tasks that have to be carried out during delivering the product to the end consumers:
- Demand Forecasting
- Sourcing
- Materials Handling
- Inventory Management
- Job Scheduling
- Production Planning
- Order Processing
The reason why this era was known as the fragmentation era was because each of
these tasks discussed above were considered as separate tasks. Separate teams were
set out for each task, and thus there was a lot of miscommunication between them.
For example, the demand forecasting team has to report to the sourcing team who
will report to the inventory management team and etc, and if some information is
miscommunicated, it could lead to chaos. Moreover, teams would have no concrete
idea on what they are supposed to do, as this separation between teams is ghastly
and does not serve the sole purpose of integrated work. Now due to this, in the 1980s,
industrialists realized that this separation is highly pointless and since there is too
much tight coupling and cohesion between these tasks, industrialists merged all these
tasks into one sole task: Optimized Logistics. Another important philosophy that
was embraced by industrialists was that supply chain work inside the operations of
the firm as well, so every process in the operations of a firm is part of the supply
chain. Every internal team member with respect to the organization was considered
a node in the network. This was one of the remarkable discerns that was made by
industrialists and committees at that point.
At this point, all industries now turned their attention to the so-called Optimized Logistics
Management. Below is a graphic view of the components involved in optimized
logistics management:
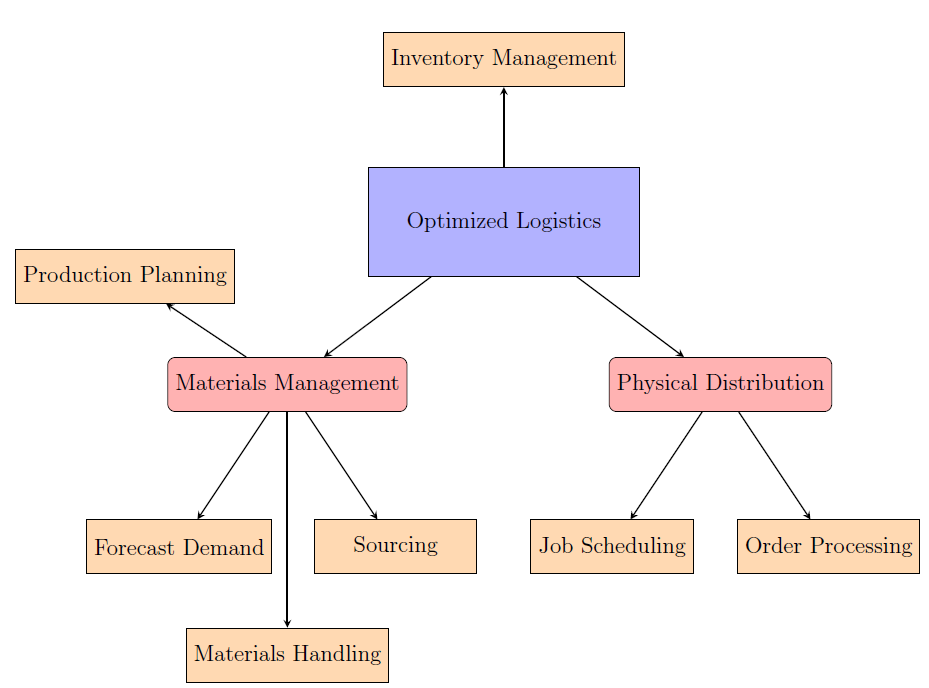
As you can see in the figure, four of the seven components involved in optimized
logistics are inside the Materials Management section and two of them are in
the Physical Distribution section. With respect to a firm, materials management
refers to cultivating and maintaining materials, while physical distribution refers to
the distribution and flow part of the supply chain. The reason why Oliver made this
distribution at that time was because he realized that to consider the entire supply
chain holistically as one functional unit, it was necessary to categorize these fragments
subtly into categories depending on the major functionality of the supply chain.
Another important decision of his was to separate Inventory Management from
both materials management and physical distribution. Since inventory management
tries to fill the gap between them, it is partially materials management and partially
physical distribution.
Now, to scent the beauty of this dissociation, we will first talk about materials
management and physical distribution, and then connect these through inventory
management. In each of materials management and physical distribution, we shall
talk about why exactly these two major components contain explicitly, the minor
components.
Materials Management
When it comes to materials management, as the definition states, this is related to
manipulation of materials. If we want to manipulate materials, we need to know the
supply that is required. What motivates the decision that finalizes our bill of materials?
The demand of course. This is exactly why we need to forecast demand. Now, when
you know the demand, you need to plan the requirements and the processes, which is
why we have production planning included. What do you do after you have a plan?
We need to source the materials of course, which is why we have sourcing. Finally,
when the materials are sourced, we have to handle those materials, where handling is
an activity that is considered to choose itself from transformation or transportation.
Now that you know what exactly persists in the materials management framework,
let's dig in deeper into the four components of this framework.
Forecast Demand
When we say ”forecast”, which literally means ”predicting the future”, we expect
objects, heavily derived from the mathematical framework to be instantiated. What
kinds of objects? To know about that, keep reading, and that will be covered in the
upcoming sections.
Forecasting demand as a whole is a very complex concept. But to get a sense
of how to forecast, we generally try to derive from the marketing 2.0 framework,
which corresponded to Gen X, concepts that pertained to the creation of value. In
short terms, forecasting demand was a process that undergoes a subtle ”give and
take” policy.
Since most firms considered supply chain management as a separate functional unit, and not something that integrates with other departments, demand forecasting
was not very successful, and planned attacks seldom existed.
So how exactly is demand being forecasted? To know that, keep following me to the next sections.
Production Planning
When we have some idea on the demand, and the final features of the product are
finalized, we have to plan the requirements and the entire production process. This
is a highly generic statement, when we enter the specifics for each industry, we find
different techniques in each of them.
What we will do instead is try to write out some generic outlines as to how we
can plan our production.
Firstly, in any production plan, there are three components:
- People
- Processes
- Common Components
First, when it comes to people, there are some generic management techniques one
needs to know. Firstly, and most importantly, the transfer of artifacts between people
has to be minimized. We don't want someone to look up to someone else's work.
Next, we need to keep track of people's work. Finally, as said by Mark Christopher,
supply chain exist inside a firm as well, we must try to impart some basic supply
chain management principle while transferring artifacts from person to person.
Second, processes are something that co-exist within each other and the entire
firm. Now, we try to understand in quite a bit of detail, about process management.
Process management is the art of managing processes in ways that meet demand
after successful forecasting of it. There are three types of processes:
- Senior Processes
- Core Processes
- Supportive Processes
Senior processes are processes that govern and control the core processes and strategies
in ways that keep the deviations in statistical business figures under control.
Core processes are the processes that actually convert inputs into valuable outputs.
These processes can be considered as transformation processes.
Supportive processes are processes that assist the core processes, for example, parallel
sub-processes in the chain of core processes.
The goal of the firm should be managing these three processes in ways that meet
profitability and consequently demand. Senior processes should be very efficient and
quick in reaction. Most senior processes abide decentralized management rules.
When designing core processes, there are three questions to be addressed.
- What do we need?
- Why do we need?
- Who do we need?
The first question is in regard with the aspect that is lagging in the firm. For example,
a car manufacturer lags windshields. The second question is in regard with the reason
of that need. In the windshields situation, windshields are mandatory, because if it
rains then drivers won't be able to see clearly. Finally, the third question is in regard
with the set of ground workers who shall execute the task.
When these questions are addressed, we ask this set of questions again. Which
means, in order to successfully attach the windshield in the car, the questions are
asked once more, what do we need, why do we need and who do we need. These
questions are asked step by step until the entire design is very clear.
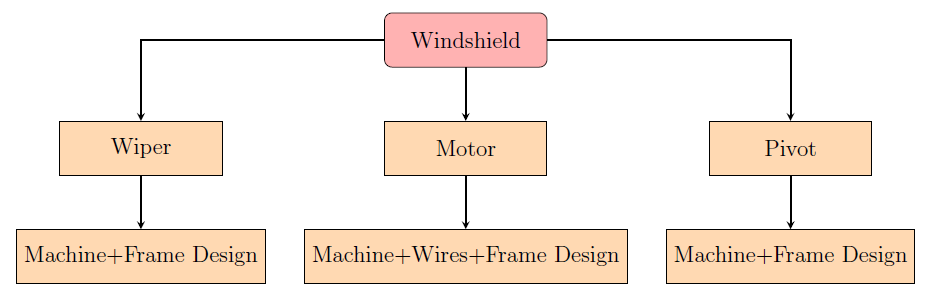
Designing requires high level of organization, after each set of questions, the needs should be arranged in order, so when we reach the final needs, where no more questions
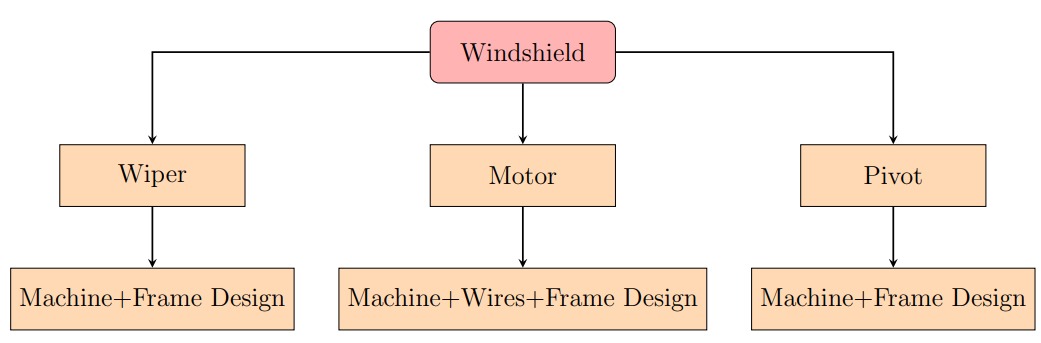
can be asked, the entire process design is in order. Here is the example of the
"what do we need" for a car windshield:
And so the root needs are reached and organized. Another important fact that we
must consider is that, when we put '+' between two non-machinery attributes, it
means there is another machine that assembles them together. So for the motor leaf,
between wires and frame design, there is a second machine that puts them together.
Finally, all the three nodes, wiper, motor and pivot are all assembled together to
make a windshield.
This means, under a node, if there are n non-machinery attributes, there should be at
least one more machine that combines those child-nodes together to make the parent
node successful.
Drawing the design in the form of a flow chart always helps, because it gives a
very good visual. Designing core processes are not the job of one man or one group.
It requires the whole organization to work towards it.
I have also discussed the notion of supportive processes above, the process that
is sub-designed under the core process that assembles more than one non-machinery
attribute is called as a supportive process. Supportive processes can also be called as
parallel dependent processes. One example of supportive processes is the HR training
process that undergoes in any firm.
When we do this, we get a very good idea as to what exactly we want and how we are going to achieve it, and therefore, it is now time to move ahead to the next step
which we must take: Sourcing.
Sourcing
Sourcing with respect to a firm is about sourcing external materials into the organization,
i.e. purchasing materials. This may sound fairly easy, but as far as Optimized
Logistics is concerned, it is not. Now, we present the sourcing problem.
Assume that you want to purchase M materials of the same type, and you have
suppliers S1, . . . , Sn, and suppler Si quotes cost ci per material. On order of xi,j or
more materials from supplier Si, for 1 ≤ i ≤ n and 1 ≤ j ≤ f(i), where f is the
function that sends supplier indices to the amount of schemes, you get a discount
of di,j percentage. Each supplier Si can supply at most Ti materials. What is the
optimal way we can place our orders to these suppliers?
We want to optimize:
where 1yi is di,j , where j is the largest positive integer so that yi > xi,j . We also have
the constraints:
as well as
yi ≤ Ti∀ 1 ≤ i ≤ n
This problem is quite complicated, as we have indicator variables appearing in the
picture. In the area of linear programming and regression, there is a technique that
deals with indicator variables called sparse regression and convexifying non-linear
programming problems. What we do here is basically use mathematical algorithms
to simplify the use of indicator variables, which we will exclude from this paper, as it
is already a huge research topic.
Once we source the materials, we move ahead to the next and the final component: Materials Handling.
Materials Handling
Materials handling can be considered as a "controlled" execution of production planning.
The fact is that things may not go as expected, and that gap is what we
call delta. To control that delta, we are calling materials handling as a controlled
execution of our plan. Here is where an extension of process management comes into
picture: Process Control.
The efficiency and effectivity of the process should be measurable, in which sense,
there should be benchmarks which can point the level of process quality. The controlling
of these parameters is called process control.
A vague picture of the measure in quality of processes can easily be figured out
while proofreading the output. But the major challenge is to figure out the exact
process and aspect that is getting out of control. In order to measure that, we have
some techniques
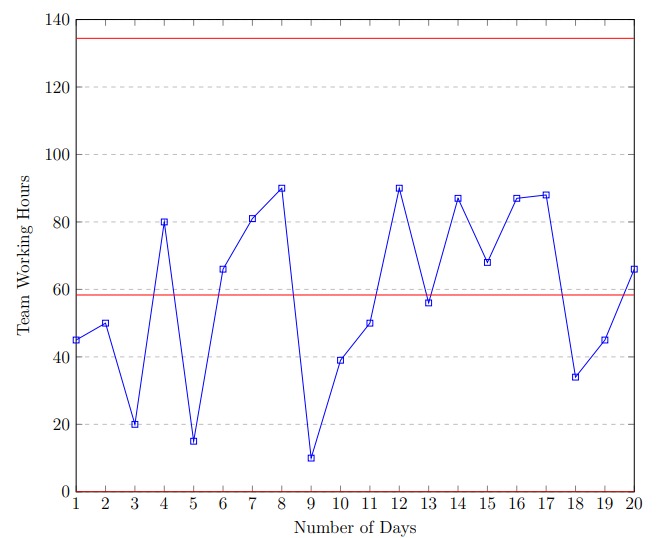
- Control Charts
- 5 Whys
- Cause and Effect Diagram
Control charts are a pictorial representation of variations in the process. Control
charts contain two limit lines, the UCL and LCL. If an attribute exceeds the control
limits, then that attribute requires serious care, else we are good to go.
5 Whys analysis is a singular approach to to understanding the root cause of the
problem by repeatedly asking 5 Whys. The answer you get in the end is the root cause.
Cause and Effect diagram is a multilingual approach to finding out all the root
causes of an effect. Each and every aspect is discussed in detail in this analysis, unlike
the 5 Whys which only goes to the root causes and does not understand the entire
context behind it.
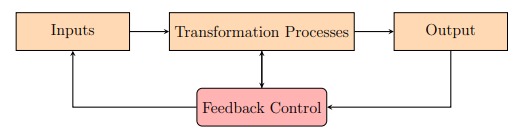
In contrast, process controls are a form of feedback and feedforward controllers,
feedback controllers being taking action after the effect and feedforward controllers
being taking action before the effect.
Investing on feedforward controllers is a lot more beneficial than investing on feedback
controllers, because the effect doesn't even happen!
Physical Distribution
Physical distribution is focused towards the other half of the supply chain. There are
two primary components in this framework, job scheduling and order processing.
I will elaborate more on what we mean by "Order". An order to a node is a
situation that commands that node to execute a certain action, in this context,
transmitting. So, an order does not necessarily have to be placed by a consumer,
an order can be placed by any other node (including that node itself). Customer
servicing is also an order.
Now, the first thing that happens in physical distribution is the wait for an order
by any node. Once we get that order, we process that order and schedule
distribution jobs amongst other nodes, for example, transport facilities. These are
the two major components in the physical distribution framework, and now we shall
dig deeper into them.
Order Processing
We must first note that the flow of information through the supply chain is as important
as that of the materials.
When an order is placed, it is important to inform node that placed the order
about the status of the delivery. Again, delivery here is a very broad term that tries
to represent the expected response to an order. So, when a product arrived, it is a
delivery, when a technician comes to service a repaired fridge, that is a delivery as well.
When an order has been placed, we need to first validate whether the order can be
delivered or not. If not, we have to pass back information that the order cannot be
completed.
Next, if the order can be processed, it is important to state the time taken for the order to be processed.
Once the order is processed, we have to inform the receiving node that the order
has been processed.
These are the fundamental concepts of order processing.
Job Scheduling
Job scheduling in the context of optimized logistics is executing a medley of tasks in
an optimal amount of time. Therefore, we present the generalized assignment problem:
Assume that we have to complete tasks t1, . . . , tn and we have resources r1, . . . , rm.
The cost to assign task ti to resource rj is ci,j for all 1 ≤ i ≤ n and 1 ≤ j ≤ m. Find
the most optimal way to execute these tasks.
We say that xi,j = 1 if task ti is done by resource rj and 0 otherwise. Then,
we want to optimize:
Which can, yet again be solved using linear programming techniques.
Inventory Management
As we said earlier, inventory management fills the gap between materials management
and physical distribution, but why? First, let's understand the concept of an inventory.
The most common mistake that is made by people, is that people consider an
inventory as a godown. This is what firms thought in the 1950s, i.e. the misconception
era, but an inventory is a lot more than that.
Formally, an inventory is the element that connects two disjoint processes in the
supply chain. In the entire supply chain, we have multiple disjoint chains, a product
cannot be engineered in one go from the raw materials. When materials go through
a process and transform into artifacts that concludes a chain, we need to store those
artifacts in an inventory, and then those artifacts are pushed in as materials in another chain. The creation of artifacts falls under the materials management framework,
while the distribution of artifacts from one chain to another falls under the physical
distribution framework. This is exactly why we claimed that inventory management
bridges the gap between the two frameworks.
In the optimized logistics framework, the primary objectives that we want to attain
through inventory management are:
- Easier locating of goods
- Minimizing physical risk and motion waste
- Coupling disjoint processes
- Controlling inflow and outflow of goods
We are now ready to formally define inventory management:
Definition of InventoryManagement
Inventory management is the art of optimizing
inventory costs, minimizing transportation cost and classifying inventory stock.
Minimizing transportation costs has been discussed in the earlier chapter, where we
presented the generic solution to the generic transportation problem, so we will be
talking more about optimizing inventory costs and classifying inventory stock.
Optimizing inventory costs
Inventory cost consists of three different costs:
- Ordering cost - cost that is payed for ordering goods.
- Holding cost - cost that is payed for storing the goods, such as, depreciation,
deflation, taxes, spoilage, etc.
- Shortage cost - cost that is payed when an order is placed by the customer but
there is no stock in inventory.
The firm's key goal must be to minimize these costs. The first and foremost cost that
must be minimized is shortage costs. The other two costs don't make direct impact
of the firm in the market, while shortage costs may deduce customer retention rate.
The second most important cost is the holding cost. Storing too much of inventory is a phase of waste, especially for expire-able products, since they have a deadline
of usage. Most importantly, overloading of inventory causes blockages in the supply
chain, which is dangerous for the firm. The final and the least important cost is the
ordering cost.
Firstly, shortage cost should not exceed a penny. Secondly, holding cost must
be minimized. That means, we can minimize both the shortage cost and holding cost
by purchasing goods that are equal to the customer demands. This way, maximal
goods shall take part in the supply chain, thus minimizing blockages. As professor
showed us in the simulation exercise, minimal inventory is better than inventory
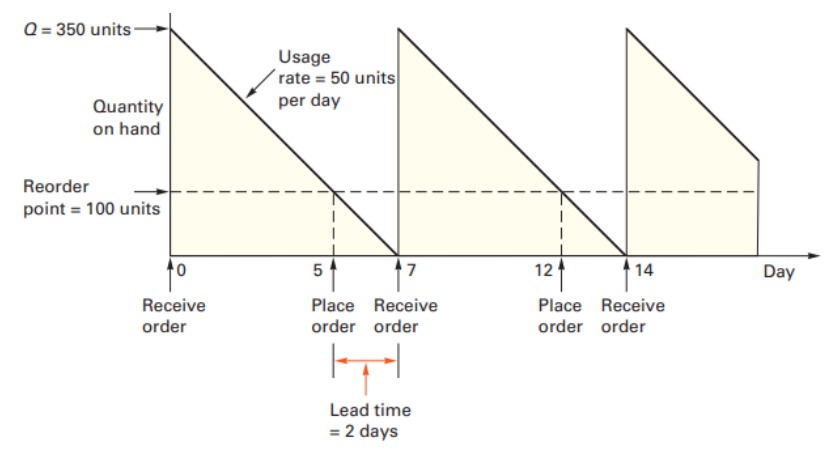
overload. We can thus mathematically conclude that the reordering point would be
when
Stock at point = Forecasted demand x Receiving time
and the reordering quantity would be
Reordering quantity = (Receiving time + gap) x Forecasted Demand + U
Here, receiving time is the time taken for the goods to enter the inventory. U here is
the extra goods required in case there are any variations in the forecasting (buffer
stock), and we are doing this because, shortage cost must equal zero. Finally, the gap
is the number of days in which the reordering point appears. It is best that gap is
minimized, because variations in demand shall cause blockages which can be painful.
We have seen how industrialists worked with optimized logistics. Now in the next
chapter, we will see how industrialists completely changed their thought process.
Classifying Inventory Stock
The most important differentiation between an
inventory and a godown is that, an inventory classifies its stock and maintains a
proper catalogue of it's items. How exactly does the inventory classify its stock?
First of all, inventory stock must be classified based on the demand of products.
There are different analytical techniques to classify stock, such as ABC Analysis
and Movement Analysis which were discussed in my previous article, MBO in
Investments. When we classify inventory stock appropriately, it becomes easier to
locate items, and most importantly, keep the interfaces for delivering high-in demand
products easier to access.
To conclude with, inventory management is one of the most important components
in optimized logistics that minimizes blockages, or bullwhips in the supply
chain.
Integration
Up till now, we saw how the world changed its views and perceptions on supply chain
management from the second world war, till the 1980s, where industrialists considered
supply chain management as a disparate functional unit. During this period, a
double-dip recession hit the world, which caused severe inflation and unemployment.
Why is it that this event occurred? What caused this recession? To understand that,
let's first understand the situation that we can imply from the discussions above. As
you might have noticed, firms at that point of time spend money on the delivery
of a product without a foolproof plan. Why do we claim that they did not have a
foolproof plan? Well that's simply because the forecasting of demand cannot be done
without deriving concepts from marketing!
Now let us understand what causes a double-dip recession. But before that, what is a
double-dip recession? Well, a double-dip recession is a recession followed by another
fresh recession before the old recession occurred.
What causes the original recession then? Generally recession is caused when inflation
increases, and inflation is caused when too many loans are pending to be
fulfilled. The double-dip recession is caused when there is an imbalance between
demand and supply, which would cause high levels of unemployment, or wages would
be incredibly high.
Getting back to the story, at this point of time, most firms did not forecast demand,
and to execute the optimized logistics, they took loans from banks. But in
the end, firms went in losses, since the demand wasn't forecasted, and loans were
pending to be fulfilled. When most firms are facing losses, there would be one firm
where a lot of traffic hits, and that is where the bullwhip occurs in the supply chain,
unlike other firms where demand was less and supply was high, here, it would be the
opposite, demand is high, while supplies are less. This made the few firms that hit a
lot of traffic to increase prices in products, due to which inflation occurred, and this
combination caused the double-dip recession.
During this period in 1982, a man and his friend Tim Laser coined a term called
Integrated Inventory Management, and the main idea behind that is to integrate
optimized logistics with the other functional departments such as marketing and
finance.
During an interview with electronics giant Philips, that man was triggered by a
customer service manager Van T 'Hoff, where that man couldn't explain briefly about
his idea of I2M. Due to this, he sub-consciously named his idea in that interview as...
"Total supply chain Management". As you might have already guessed, that man is
none other than Keith Oliver.
From that point onward, in the near 1990s, firms started to integrate supply chain
management not only with the operations team, but also with teams such as marketing,
finance and HR. This re-shaped the way firms forecasted demand, and now you
shall see the second part of demand forecasting:
Forecasting is a concept that relies on three things:
- Data
- Mathematics
- Approximations
Which can be mathematically represented as
Forecasting = f(Data, Mathematics, Approximations)
Forecasting can be successful if and only if, the customer inputs are converted into
an output, which means, the consumer behaviour and responses should be converted
into a superior product with high quality measures.
The most important aspect of all aspects in forecasting is the observational data
that the firm has, in which sense, the data available about consumers on other
firms. A combination of observational data and customer responses from appropriate
questionnaires (which is carried out by the marketing team) shall reveal the problem
that consumers are facing, and a vague figure of the demand that shall arise, for
example high, medial and low.
To come out with more accurate figures, the firm must measure customer responses
by the most challenging problem they are facing, for example, scrolling down to the
bottom of a page on button phones. Another important fact that must be taken
into consideration is that when a consumer invests his time into answering the firm's questionnaire, he has some genuine interest towards the firm.
Now the excitement and enthusiasm of the questionnaires responses shall be categorized
into three:
How do we measure excitement and enthusiasm? Well, excitement and enthusiasm
are inversely proportional to the current comfort levels that the target market has
with respect to the domain of our firm, so we can categorize the excitement and
enthusiasm by reverse-engineering the responses given in those questionnaires.
Assume that h are highly enthusiastic responses, m are medially enthusiastic responses
and l have a low level of enthusiasm. If the marketing and quality combination is
done very well, then those h customers shall be the first to purchase the product
at it's release. The next question that arises is, how many of the m + l customers
shall purchase the product? In order to answer that, more questionnaires should be
released to samples asking them about their expressions about products of other firms
when those firms sent them a set of questionnaires regarding their product. Sample
size shall be selected through concepts in sampling theory which shall not be discussed
here. When a set of a customers react to medial and b of those purchased the product,
then b/a of the medial customers bought the product, while in the low category, d/c
bought the product. Circulating such questionnaires to samples about different firms
shall yield the percentage of medial and low customers that actually bought the
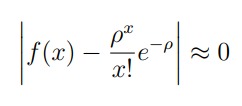
product. Taking the poisson distribution shall tell the firm the two percentage rates
ɑ and β of medial and low customers respectively who bought the product after it's
release. So, the demand estimate would be
and thus the demand is forecasted.
Note that this is a very simple model presented above, complicated models require
gritty estimates which shall not be discussed in this article. From the observations
above, we see how we instantiated objects from the marketing 2.0 framework, and how tight, marketing and supply chain management is.
This decision by firms is one of the most remarkable decisions, where optimized
logistics are aligned to various strategies that are present in the strategic growth
framework. This was the turning point in the evolution of supply chain management,
and of course, the most historical age since the past fifty years of evolving, and
evolutions to come.
Automation
While supply chain management did evolve well, in the early 2010s, we entered the
digital era. At this point of time, firms really needed to move from the traditional
way of supply chain management to incorporating technologies in supply chain management.
The first technology that was incorporated in supply chain was the IOIS, i.e. Interorganizational
information systems. The IOIS tried to come close to the modern day
technologies such as AI and IoT, but unfortunately, it failed, due to lower granularity
levels. The IOIS had five levels of participation:
- Remote I/O node - This creates point-to-point interactions between firms and
a sensor on the local I/O enables actuators to begin the processing.
- Application processing node - This takes into consideration the details given by
consecutive firms for packaging and delivery, and executes the task as needed.
- Multi-participant exchange node - This is a degree addition of the previous
node. This node enables multi-application processing, from one point to different
low-level points.
- Network control node - This node automates maintenance of inventory levels,
figures out potential errors in the network and fixes them, so it is basically a
feedback controller.
- Integrating network node - This node allows other firms to integrate themselves
in the supply chain, yet keeps the entire processes above stable and secure.
The reason why it was less granular was because it couldn't manipulate information
well. Now, we shall move on to the latest technologies, and how the escalate the
quality of supply chain management. The two technologies that we will be talking
about are:
AI & IoT
The world is changing, earlier we used to have people doing physical jobs, such as
delivery boys, drivers, cleaners, carpenters, technicians, and now we are going to have
drones, self-driving cars, robots that clean entire houses and robots that can literally
build themselves! The world ahead of us is going to be conquered by robots, robots
shall replace humans, only innovators shall survive and the rest would be leading a
miserable life! Drivers, cleaners, delivery boys, all go out on strikes, because if you
don't, then you may not survive.
This is a common misconception that the entire world has on AI. Many even go to
the extent of demoting AI & IoT and many went out for strikes. The fact that the
common man is not realizing is that AI & IoT are just regular devices and have
boundaries. As Grady Booch explained in his ted-talk, "To create a machine that
can replace human, it would require way too much of training". So what exactly are
AI & IoT, and why can't they replace humans even at the most mundane job ever?
To understand that, let's first grind some fundamentals out of AI & IoT.
AI when expanded stands for "Artificial Intelligence". Before understanding what
this term means, let us first understand what intelligence means.
Intelligence contains two components
- Learning Ability
- Analytical Ability
Learning ability is about the ability to process information, mostly inputs and outputs.
As mam cited an example, you have cats and dogs. When you feed yourself those
images, and the labels, you realise that "if it looks like this, then it is a cat, otherwise
it is a dog". Throughout our whole life, we have been learning. How else does a kid
speak his mother tongue without any training? The kid hears the input, and sees the
output, and then realises what his parents are talking about. When his mom says:
"Darwaja Khol", which stands for "Open the Door" in Hindi, the kid sees, that when
the Hindi word is uttered, that particular action has to take place, so the next time
his mom says the same thing, he will go and open the door.
Analytical ability is the ability to compare two different data sets and create an
inference. When experienced HRs validate interviewees within seconds, it is not
because they have magic inside of them, but they have seen multiple candidates. Here,
they notice two different data sets, one, the set of answers to questions, and two, their
performance. What they are doing here, is they are feeding themselves with data,
which is then processed into experience, and next time when a candidate utters similar
answers to a candidate that did not perform well, the HR wouldn't hire them at all.
Artificial intelligence is trying to push these abilities inside that of a machine. When
we do so, this might allow machines to give valuable "predictions" using big data.
Now, what is IoT? Well, IoT, which is expanded as internet of things, is basically
a data adaptor that converts a physical scenario, such as the tap of a button,
into an expressible event inside the cloud.
Generally, when we talk about modern day technology, we cant seem to separate AI
and IoT, and instead, we talk about the Interplay between AI & IoT. The IoT collects
information and passes it on to the AI, which then takes a decision and the IoT
expresses that information back, physically. For example, consider the case of looking
for firearms. The IoT sensor that takes an X-ray of the luggage sends the X-Ray-ed
image to the cloud, where the AI exists, and the AI validates the information. If there
is a firearm, the AI reports back to the IoT, which then expresses the result: an alarm.
I will now answer the hot question: why can't AI& IoT replace humans. You
see, the difference between us humans and machines is that, our brain is boundless.
Humans have no boundaries, our brains can stretch to extreme limits, unlike machines,
which have a boundary.
In every class of situations, there exists a layer of situations, which we call ”Noise”.
These noisy situations are known as unexpected situations. When an AI encounters
unexpected situations, its analytical results could create ruckus. How? To understand
that, let's take the case of self-driving cars.
Assume that a driver is going across a street, and he encounters a man in the
middle of the road, laying down, injured. Obviously, that man will stop the car and
go help that man.
When it comes to self-driving cars, the IoT sensor of the self-driving car would
send the information of something ahead in the road. The AI device might not
have been trained to identify injured people that it would stop, and so instead, it
considers the injured man as a speed breaker. The moment this decision is taken by
the self-driving car, the car would go over the injured man. This is an example of
why AI & IoT cannot replace humans.
Another famous example, is the worlds first ever robot-staffed hotel. The guests of
this hotel had a nightmare of a stay, since the robots misinterpreted the snoring of a
man as a call for room service and kept belling the guests all night.
The real question now is, how in the world then, do AI & IoT benefit us? The
true benefit arises only when these technologies are used only where they are supposed
to be used. If you give a carpenter a driller who uses it as a hammer, he would
return with holes in walls, and of course, several smashed fingers.
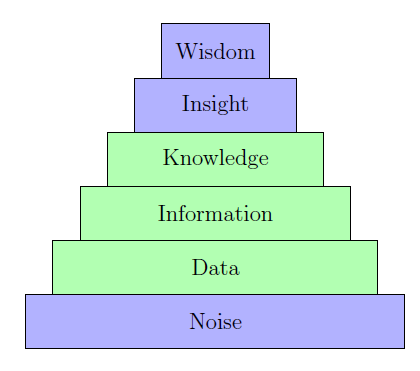
This is where the human-machine pyramid comes in. The human-machine pyramid
gives a clear distinction as to what the roles of a machine are, and what the roles
of a human are. Here is the pyramid below. The blue sections are tasks that would
be carried out by a human, and the green sections are those which should be carried
out by machines.
Let us describe these six roles in detail:
Wisdom
Wisdom is something that is purely attainable only by a human, and
wisdom is about making wise decisions. This stands on top of the pyramid, since this
is the exact reason why we humans are much more intelligent than robots.
Insight
Insights are something that relate to the analytical abilities, the conclusions
we can draw from situations. This is also something that has to be majorly
taken care of by a human.
Knowledge
This is the repository of inputs and outputs that the machine stores,
which it will use to take a decision in future.
Information
Information in this context is about converting the data that comes
in different forms into something expressible.
Data
Data is just the set of inputs and outputs of a given situation in an unorganized
way.
Noise
As described earlier, noise is an unexpected situation, which must be left for
a human to handle.
As you may notice, we have made a clear distinction between the roles of a machine
and the roles of a human. The reason why data, information and knowledge is given
to the machine, is because machines are much better than humans at processing
data. They can organize disorganized information way better than humans, and can
easily deal with non-noisy situations. When we make use of machines from this angle,
experienced is escalated. But how can we make use of AI precisely? Well, we can
let AI handle very basic scenarios and use it as an advisor and not an actuator to
slightly complicated scenarios which would then be validated by a human.
But how does all of this relate to supply chain? You see, AI & IoT primarily
extend the original idea of IOIS, except that they provide better granularity. The
usage of IoT in supply chain is primarily arched towards inventory management. IoT
can help transfer data into a cloud which can then process and store data easily.
We wouldn't need a supervisor that notes every single transaction, but instead, we
would need a supervisor that "supervises" the information being processed. Using
IoT, we can find the item that is the most moving, and when this information is fed
into the cloud, the AI makes a recommendation to classify inventory stock differently.
That recommendation is then validated by an actual human, and then implemented
accordingly.
AI also helps in the forecast of demand. The marketing team does an additional
exercise of sending questionnaires related to the products of other related firms, the
AI then takes the data set of responses and the actual output (the results) that
happened, and tries to create a correlation between those data sets. Once we do that,
we feed the AI with the responses of the current market survey, through which the AI
makes a prediction of the amount of demand. How does it make this prediction? We
use tools from mathematics such as simple regression, polynomial regression, sparse
regression and so on.
We now move on to concepts in Blockchain and how it is being used in supply
chain.
Blockchain
Centralization is something that always co-exists, there is one guy that takes all
the decisions. Blockchain aims to get rid of that central entity, the decisions are
made by participating entities. The primary idea of a blockchain is to decentralize all
centralized decisions which we, the public have no idea of. The blockchain idea was
first implemented in currencies, the end product being bitcoin, which was published in
2008 by Satoshi Nakomoto. The main idea of bitcoin was to make secure transactions,
transactions that were immutable, and validated by a consensus.
To express the concept of blockchain, we will align the main ideas of blockchain with
bitcoin.
Firstly, there are three aspects when it comes to decentralized electronic peer-to-peer
cash systems:
- Transaction Validation
- Immutability
- Security
In addition to these, bitcoin provides us with an extra functionality which we call a
smart contract, that would create a blueprint for the transaction to be executed. A
smart contract plays an important role within blockchain. We shall understand how
bitcoin attained these in detail.
Immutability
Immutability is something that is necessary in our day to day life, we need to make
sure that information is legit. If the set of transactions that have been committed
are tamper proof, then the whole ledger is trustworthy and note that each and every
node has the latest copy of the ledger.
Satoshi presented a neat solution to execute immutability, that is, by introducing
the notion of a block and the notion of a chain. A block is a combination of
two objects, a header and a body. The body contains all the validated transactions
under a time-limit, while the header contains metadata of the block, as in, it contains
the hash value of itself, the hash value of the previous block, the time-stamp and
the Merkle-root hash. Take everything granted for now, we will explain in detail
how exactly they work, but just notice a property of the block: It contains the hash
value of itself and the hash value of the previous block. How to find this hash value?
That will be explained in the later sections, but as of now, consider hash value as an
unique identification number. By containing the hash value of itself and the previous
block, the two consecutive blocks get "chained". This means, all the transactions can be segregated into blocks with respect to time, and chained together. The entire
ledger is distributed into blocks that are chained in a consecutive manner. The first
block in this chain is known as the genesis block, which is a special block, since it has
no previous block.
How does introducing blocks and chains help us here? Well, if an evil node wants
to change any valid transaction, he must first change the block that contains it, but
changing the block causes dramatic change in the hash value, thus breaking the chain!
And that is a notification to all the nodes in the network that there is some problem,
and the change in transaction shall be rejected by all.
Transaction Validation
Transaction validation is primarily about checking whether a transaction is a double
spend or not. What is double spending? Double spending occurs when two amounts
of the same value are transacted, but only one amount is deducted. This problem
can be solved by introducing the notion of a timestamp server. If the latest digital
signature and the timestamp (of when the transaction occurred) are the same for
two coins, the miner shall reject the transaction. While if one miner accepts one
transaction and another accepts the other, then by the longest chain algorithm, only
one of those two blocks are going to be valid, thus rejecting the double-spend.
Since blockchain is decentralized, there needs to be some form of democracy in
this transaction validation, how does that happen? This is exactly where the concept
of consensus comes into picture.
There are two types of consensus, qualitative consensus and quantitative consensus.
- Quantitative Consensus - Number of people deciding upon a single transaction's
validity.
- Qualitative Consensus - Systems deciding one person who decides a number of
transaction's validity.
Qualitative consensus is better than quantitative consensus in many ways. One reason
is scalability, but the major reason is, evil nodes can create thousands of alts, and
the evil side will win the consensus, so quantitative is completely eradicated.
How does the qualitative consensus work? All the nodes in the network will be
given a certain task, and the winner of the task gets to validate the transactions.
What exactly is this task? Here is where the hash value of a block comes in. The
task, that will be given to all the nodes is a computationally difficult problem, which
is known as proof of work. The problem is to find a hash value less than or equal
to the target hash. This can be done by taking the previous completed hash and
adding a nonce to it and re-hashing the result. A nonce is an integer that is used
only once. The difficulty here is to find the nonce value that gives us a valid hash
that is at most a target hash. All the nodes work on finding the nonce value, and
whomsoever finds the proper nonce value wins. What if two people found the nonce
value in the same time? In that case, both of them get to validate the block, and
there are two "brothers" in the chain.
This causes serious problems. To solve this, we adopt the ”longest chain” algorithm.
What this does is, it takes the longest chain as the current state of the ledger,
because nodes can choose to work on either one of the blocks, and the chain that's
the shortest among both brothers would be simply broken.
How does all this guarantee that the ledger is valid? That's simply because, the
plausibility of assuming that the winner of the proof of work is honest is equal to
the plausibility of assuming that the individual who has a computer with maximal
computing power is honest. And that's pretty true, because authorized entities only
own quantum computers. The longest chain algorithm also shows that the longest
chain between brothers is more valid, why else will honest nodes invest their time
onto it?
Even though what we said above seems intuitively good enough, to convert it into
code, it requires a lot more details. So, let us understand how hash functions work.
A hash function is a 1-way trapdoor function, which means, it's easy to go from the
input to the output, but very difficult the other way around. Another important
property of the hash function is that, any minor change in the input causes extreme
changes in the output, in which sense, there is no pattern in the hash inputs and
outputs. Another interesting fact of the hash functions is that, their output string
length is precisely 256 bits, no matter how small or large the input is.
A question that arises is, since the length of the string is fixed, there are only
finitely many possibilities, precisely 2256, so what if, between some two inputs, a
collision happens? That is,
H(X) = H(Y ),X ≠ Y
The best possible thing we can do, is to reduce the collisions. A hash function is
more collision resistant when the algorithm behind it is very good. The hash function
that is used in blockchain is called SHA256, that is, Secure Hashing Algorithm 256,
and has been designed through the Merkle-Damgard construction. Let us understand
this a little bit:
We begin by padding bits to a multiple of 256, which means, if the string length is a,
then we pad -a (mod 256) more bits to the original string, and the additional b bits
that we're concatenating, the first bit is 1 and all the others are zeroes. Assume that
the resulting string has string length 256n, where n is a positive integer.
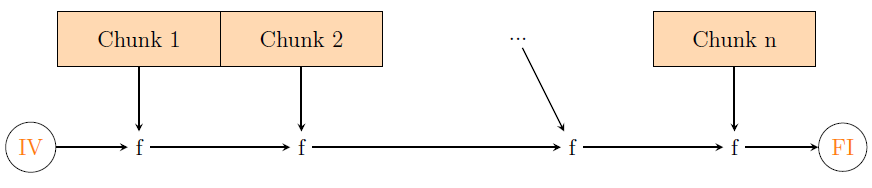
Divide the bits into n chunks, each containing 256 bits. Initialize a value, IV, which
is 512 bit and choose a compressor function f, such that when two inputs are entered,
and one of them is 256 bit, the output is 256 bits too. This can be done through
logical, bitwise left and right operators. Apply f on IV and the first chunk, and you
get a result. Apply f again on that result and the second chunk to get another result.
Apply f yet again, on the final result and the third chunk and keep iterating this
process until you reach the final chunk. Apply f on the final chunk and the result
you got after doing this process n - 1 times to get the hash output FI. The figure
above illustrates what we are saying.
Now, the question is, what is the basis of validation? We told that it's respect
to time, but how exactly? First of all, the process of finding a valid hash for the
block is known as mining, and the set of people who work on mining are known as
miners. On average, a block is mined in 10 minutes, and within those 10 minutes, the
transactions that have been committed would be validated, and the valid transactions
would be filled in the body of the block. The next 10 minutes would receive more
transactions, those would be validated too and put in the block, and so on. An
approximate of 2016 transactions are made within these ten minutes.
Security
Transactions between two parties must be uninterrupted, which means no third party
can interfere. To ensure security between two parties, cryptographic algorithms, such
as Diffie-Hellman, RSA and ECC are imparted.
The most common theme of all cryptography algorithms is the Public key, Private key
algorithm. It's more of a ”lock and key” method, but let's follow standards for brevity.
The public key, private key algorithm works as follows:
- Let A,B be the communicating parties and E be the eavesdropper.
- A sends a lock to B, a copy of which is gone to E, since he's eavesdropping.
- B uses the lock A sent and encrypts the message he wants to send, and sends it
publicly.
- A receives the locked message, uses his key and opens it, while E is busy trying
to find out how he's going to unlock the locked message only using the lock.
The strength of the entire algorithm lies on how hard it is to find the key from the
lock, and the crux of the algorithm is to be able to find the lock and the key.
Converting into mathematical terms, let's learn the RSA algorithm. As of now,
we shall be talking in numbers, and not in words.
The RSA algorithm makes use of a very unique fact. That is, when p and q are
sufficiently large primes, multiplying them maybe easy, but knowing that pq is the
product of p and q is very difficult. Now, choose e such that gcd(e, φ(pq)) = 1 and
find the multiplicative inverse d < ϕ(pq) of e modulo φ(pq). Here are the following
steps for RSA:
- A sends B the public key (e, pq).
- B encrypts the message m as me (mod pq), the resulting answer that he gets is
sent to A.
- A encrypts the message by doing (me)d ≡ m (mod pq), and thus the communication
is successful.
- Now, E has (e, pq) and me (mod pq). He won't be able to do anything with
this, because to find m, he needs φ(pq), which cannot be found through pq, and
thus the transaction is secure.
Although the RSA algorithm seems good, it takes a lot of CPU time. There's another
algorithm known as ECC, which stands for elliptic curve cryptography.
Upcoming texts are going to involve pure mathematics, we begin with the notion of
a field. A field is any set (possibly infinite) which is algebraically closed. The set of
reals, rationals, complexes are a field, while the integers are not, because division is
not closed. The field which we will be emphasizing more on is Fp, which is the set of
integers modulo p, and remember, this is indeed a field.
We define elliptic curves over Fp as
y2 = x3 + ax + b
where 0 ≤ x, y ≤ p and 4a3 + 27b2 ≠ 0. This expression is the discriminant of the
curve equation above, and we don't want it to be 0, because we don't want double
roots in our cubic.
Now to actually consider elliptic curves with the specified conditions, a field, it
must be algebraically closed. So, we need addition, multiplication and inverses to
be defined, and moreover the algebraic properties such as associativity must hold.
Remember, in all the mathematical expressions, we take modulo p to make sure that
we are talking in Fp.
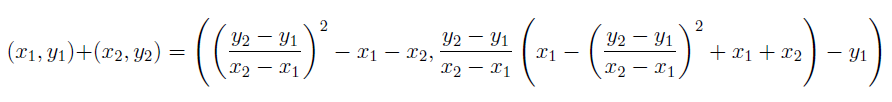
We define point addition of two points A and B, as the reflection of the point
C over the x-axis, which is the intersection of the elliptic curve and the line AB.
How do we know if such a point exists? Well that's the property of the elliptic curve
we chose! For any two points on the curve, there exists a third point on the curve
such that those three points are collinear! Note that A + B = B + A here, because
the line will anyway hit C. Proving associativity is a good exercise, as well as highly
computational, hence we shall omit it in this text. For the reader's information, we
have:
where all indices are taken modulo p.
Before we define point multiplication, let me define point doubling. Point doubling
is when you add a point P to itself, which means, the line that we're considering
is the tangent to P at the curve, and that intersects the curve at Q. Then the
reflection of Q over the x-axis is the point that is doubled.
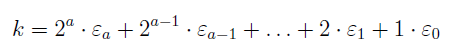
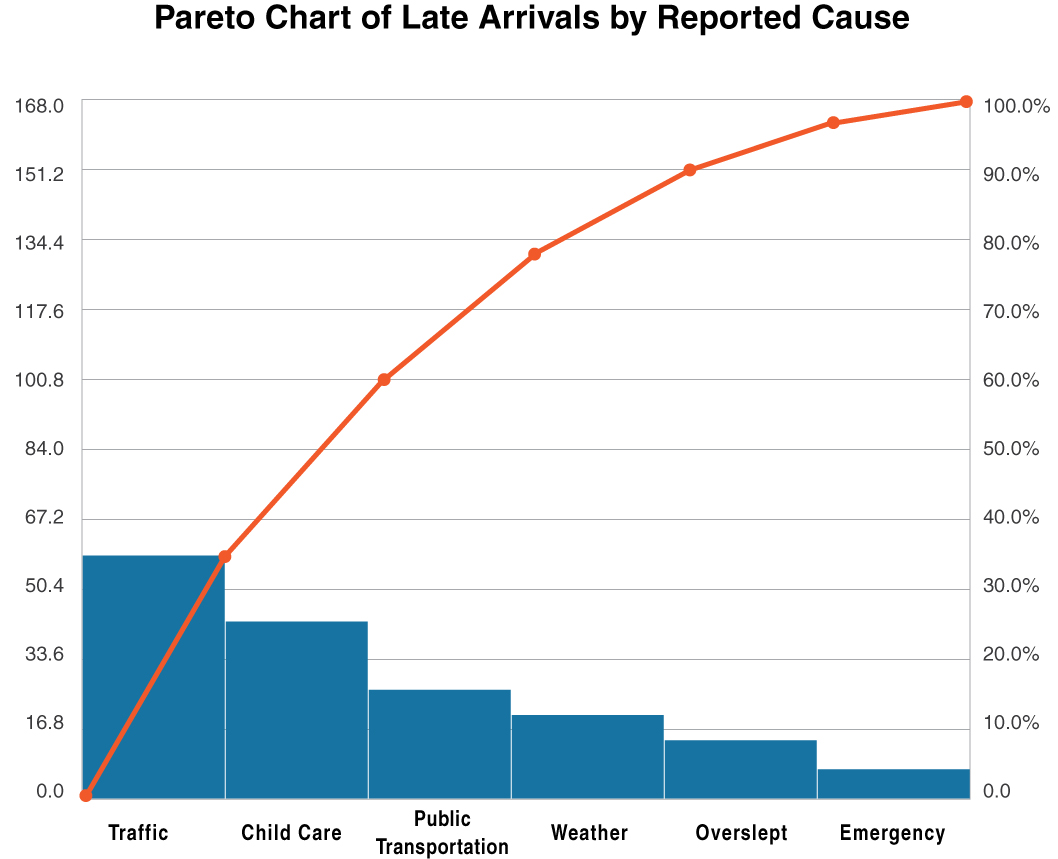
Let's suppose we want to define kP, where k is any positive integer, and P is
a point on the curve. We take the binary representation of k:
where a is the unique positive integer such that 2a < k ≤ 2a+1 and ϵi are all integers
in {0, 1} for all 0 ≤ i ≤ a. So, we have
We now calculate
where 2iP is defined to be P being point-doubled i times. Then we use the associativity
property of point addition to add the entire sum one by one and finally we reach
our point Q. Again, indices are taken modulo p. Now why did we go for the binary
notation? That's because multiplying a point by 2 is well defined, and associativity
of point addition exists too, so by using binary notation we can successfully and
uniquely calculate any scalar multiple of P.
All the heavy math is done, but how are we going to use all this into the public
key private key algorithm? The experienced reader would have noticed that, if
Q = k · P, and we know (P,Q), we won't be able to find k, which means going
from (P, k) to Q is easy, but going from (P,Q) to k is very difficult. Although shor's
algorithm in quantum computing has cracked this, not all hackers have quantum
computers, so we're relatively safe. Whether this is super strong or not, it's surely a
lot more secure and less costlier than RSA algorithm.
Let's now go to the elliptic curve cryptography algorithm:
This algorithm is a slight modification of the public key private key algorithm, since
we have two private keys here.
We now have a concrete understanding towards encrypting/decrypting protocols. But
cryptography in blockchain does not end there! Assume that A makes a transaction
with B. To make sure that the transaction has not been interrupted, blockchain uses
the digital signature algorithm, which is DSA. What this algorithm does is, using a
public key which has been sent by the sender A, it will verify if the digital sigature in
the transaction matches with the output of the algorithm. And the public key has
been designed in such a way that when the transaction is interrupted, then the digital
signature would have changed. And this implies that the public key has something
to do with hash functions.
The most common digital signature algorithm, is the Elliptic Curve Digital Signature
Algorithm, or in short, ECDSA.
The algorithm has three steps, generating the public key, creating the signature
and finally verifying the signature. Let us understand them one by one:
- Generating Keys. We set the elliptic curve for this algorithm to be a multiple
of a sufficiently large prime p and let P = (x, y) be a point in the curve E.Generate a private key d ∈ [0, p - 1]. Compute Q = dP and let the public key be (E, P, p,Q).
-
Creating Signature.
To sign a message t, we have the steps
-
Verifying Signature. To verify the signature (r, s), we have the steps
- Verify that r, s ∈ [0, p - 1].
- Compute H(t'), where t' is the received message.
- Compute u = H(t')s-1 (mod p) and v = rs-1 (mod p).
Very well, how exactly do we implement this into blockchain? Well, the definition of
an electronic coin is a set of chronological digital signatures. If an interferer tries to
change the signature, then the algorithm will detect the change and thus reject the
transaction.
The Merkle Root Hash
Computer science algorithms and graph databases play a prominent role in blockchain.
When a node wants to validate any previous transaction in the ledger, it would be
way easier to search the transaction, than continuously downloading latest copies of
it, which is huge in size. Here is where Merkle root hash comes into picture. This is a
graph database algorithm which allows us to efficiently sort transactions. Merkle root
hash and B+ tree have a lot of similarities, the major similarity being the sorting
principle. We would actually like to say that merkle root hash is the general hashed
version of B+ tree, but we won't be discussing too much about the B+ tree, so let's
dive into the algorithm right away.
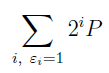
For brevity purposes, assume that there are only eight transactions in a block,
A,B,C,D,E, F, G,H. We have their hashes H(A),H(B),H(C),H(D). Then define
H(XY ) = H(H(X) + H(Y ))
and also H(ABCD) = H(H(AB) + H(CD)) and finally H(ABCDEFGH) =
H(H(ABCD) + H(EFGH)). So the tree goes like this:
To reach to the destination of the transaction, we impart a similar idea as used in B+
tree, which is indexing. Here, the indexing is the concatenated transactions, so we
can surf through indexes and easily land onto our desired transaction.
A question is, why do we need to keep all these complicated hashes? Merkle root
hash has another job too, and it falls in the immutability category. When we said
that if a transaction is interfered, the entire block is interfered, that is because when
you change even one transaction, the merkle root of the block, which is the topmost
vertex in the graph, i.e. the vertex from which the tree begun, changes. We can also
figure out which transaction is invalid by checking the previous state of the block,
comparing the hash values in the tree. One by one we descend down the tree by
traversing through vertices whose hash values don't match and we find the transaction
that has been changed.
Smart Contracts
Smart contracts are nothing but a piece of code which execute a particular task,
provided pre-determined conditions are satisfied. In other words, they are contracts,
but automated. Let's consider this example:
Alice and bob sign a smart contract that if bitcoin's value is more than ethereum's
value in the next week, Alice shall pay 10 bitcoins, and Bob shall do the same otherwise.
Now, if the condition above is true, 10 bitcoins shall be automatically deducted
from Alice's account. If it's false, the same shall happen with Bob.
This is just a vague example that we have taken, but you may wonder, what is
the application of smart contracts in blockchain? What is the power of smart contracts?
We would say that the power of smart contracts is huge, but for now let's
understand how bitcoin smart contracts work.
When we, earlier told that an electronic coin is a chain of digital signatures, the
signatures are signed on a smart contract which then deduct the amount from the
payer's account. Which means, if A wants to send B 100 bitcoins, A signs a smart
contract which then deducts 100 bitcoins from A and transfers it to B. Now to actually
verify that the signature in the smart contract is the signature on the bitcoin, a miner
uses the digital signature algorithm and validates the payment.
The applications of smart contract in bitcoin is not that vast, but it surely is
when we change the point of focus to ethereum. Ethereum has a lot more features
apart from those of bitcoin, some with more granularity, and some are completely new.
Some basic examples are running funds. So, five people have a common ethereum
account and they have boundaries as to how much ether they can withdraw every
day. Someone has one hundred percent rights, someone has five percent rights and etc.
A very good example is the internal consensus. What happens here is, there are a set
of people (not everyone) in a common ethereum account and an internal consensus is
held to take a decision, whether to keep a particular node in their private network or
not. If majority says yes, then he is in, else he is out. Ethereum has also enabled
liquid democracy delegation.
Apart from all this, we at gboxz family believe that smart contracts can be used to
change the way this world works. Making violation of financial agreements practically
impossible, and the concept of a smart contract can be given another dimension of
extension, taking it from finance to other aspects of the world. But in this paper we
will be talking only about the financial aspects.
Talking about finance, ethereum has incorporated financial derivatives through smart
contracts.
What happens here is, when A has purchased the right, but not the obligation
to buy some shares of an ethereum account (fund). Now, if A does not want to buy
the shares, the smart contract stays silent, while if A does want to buy the shares, the
amount needed to buy the shares is automatically deducted from A and transferred
to B and A gets the shares of the company.
PBFT - A misconception
In many articles and websites across the internet, there are claims that show that
PBFT is used for deciding a state of the ledger, but there is no notion of game theory
in the bitcoin whitepaper. In the ethereum whitepaper, it is clearly written that
"The main roadblock that all pre-Bitcoin currency protocols faced is the fact that,
while there had been plenty of research on creating secure Byzantine-fault-tolerant
multiparty consensus systems for many years, all of the protocols described were
solving only half of the problem."
And it's very true, because PBFT assumes the fact that at least 75% of the nodes
are honest, but this can easily be countered when all evil nodes create thousands of alts.
When the Byzantine generals problem was published, we were talking about individual
people. One person cannot have two different faces in real life, so assumptions
like above are plausible. But in the internet era, one person can have not two, but
thousands of faces, making it practically impossible to satisfy the hypothesis.
Types of Blockchains
There are four kinds of blockchains:
- Private Blockchains
- Public Blockchains
- Permission-ed Blockchains
- Consortium Blockchains
Private blockchains are those blockchains that work within an institution. Public
blockchains are blockchains where anyone can participate. Permission-ed blockchains
are those blockchains where people that pass through certain regulators can participate,
and finally, consortium blockchains are a collaboration of private blockchains, where
the nodes that participate in the consensus are pre-defined.
Blockchain for supply chain
Now we come to the real question: how can we use blockchain for supply chain?
Blockchain can be used in supply chain in a multitude of ways:
- Getting rid of counterfeit markets
- Imparting contracting between nodes in the supply chain network
- Allows user to track their product
The first aspect is a very very sensitive one. As you can notice, many eatables and
drugs are sold at a much higher price than the original one. So, when a counterfeit
institution makes a transaction from a legit institution, the transaction is recorded,
and therefore if the counterfeit institution increases the prices, by querying his transaction,
we can figure out that the institution is counterfeit.
Contracts between nodes in the supply chain can be automated through smart
contracts, as mentioned earlier.
Users can track their product from the manufacturer all the way to the post office,
since every successful delivery is a transaction, and that allows users to feel more
secure to transact with an organization.
Conclusion
supply chain management has been evolving ever since the second world war, and
we got to see multiple drastic changes within the concept. The ways in which people
looked at supply chain management, from an absolutely disparate fragmented
functional silo, to a completely integrated robust system within all organizational
activities such as marketing and finance. In the end, as all practices surrender to
modern-day tech, the dominance of AI, IoT and Blockchain is apparent.
Technology for supply chain management is a holistic concept, AI& IoT help enhance
precision in the day to day supply chain management decisions, while Blockchain
enhances trust within an organization through immutability. Overall, supply chain
management is an evolving concept, which shall continue to evolve, for time now, and
for generations to come.
Quality Control
What is Quality?
Product quality, in intuitive terms, is a measure to how good a product is. But professionally
speaking, we define product quality as
Definition of Product Quality
Product quality is a characteristic that defines the degree of
the customer's exclamatory sense in a positive way.
Total Quality management as a whole can be divided into three different parts
- Quality by Design
- Quality Control
- Quality Improvement
According to the father of quality, Dr. Juran, TQM, that is total quality management divides
itself into eight different parts;
- Customer focus
- Customer focus
- Process centered
- Integrated systems
- Strategic & Systematic approach
- Fact based decision making
- Communication
- Continuous improvement
Let us briefly discuss each of these points:
Customer focus
Focus must be towards customer satisfaction. No matter how much
efforts have been put into creating the product, if the paradigm is not customer-centered,
then the product will not reach it's targets.
Employee involvement
Here is where MBO comes into picture, employees shall
give their best investments only if they are motivated, have rights to make decisions,
and note that the employees of a firm from all hierarchies represent the quality of the
product/products.
Process centered
Lack of set processes of a firm are the major cause of fall in quality.
The firm must have set processes integrated in it's skeleton, in order to increase quality.
Integrated system
Quality management systems play a crucial role in quality as
they unite the design of a product with business processes in ways that benefit the firm
and it's stakeholders.
Strategic & Systematic approach
In order for a firm to achieve it's business goals,
there must be quality-centered strategic plans that help the firm improve quality.
Fact based decision making
The performance of a firm must be determined through
business figures and immediate action-plans must be enforced to increase performance.
Communication
When a firm makes dramatic changes for business improvement,
each and every employee must know the changes in order to invest their time and work
appropriately that causes qualitative improvement.
Continuous improvement
Quality is all about improvement! Appropriate applications of quality principles installs kaizen slogans in the firm, thus causing drastic
improvement in quality and increases business figures in a positive manner.
Earlier, we broke quality management into three different sectors, and now we have broken it
into eight different crumbs. That means, each of these eight different crumbs belong to the
three different sector in some sense. Thus, we classify the eight crumbs into the three sectors
in the following way:
Quality by Design
- Customer focus
- Employee involvement
Quality Control
- Process centered
- Integrated systems
Quality Improvement
- Continuous improvement
- Communication
- Strategic & Systematic approach
- Fact based decision making
We are now ready to formally define TQM:
Definition of TQM
The art of managing the whole, to get a high degree of excellence.
What are the benefits that is yielded when TQM principles are applied? Here are the benefits:
- Reduce risk
- Prevent problems
- Solve problems
- Control processes
- Reduce cost of quality
- Increase productivity
- Improve supplier performance
And the most important benefit of them all is to increase quality of the firm in all aspects,
not just the quality of a product.
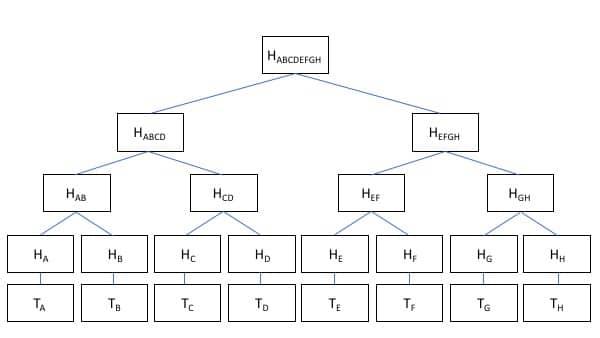
Although all this looks good, there is a cost that the firm must pay, which is known as
the cost of quality. This cost can be visualized as:
The cost that is payed due to poor quality of a product is known as the cost of poor quality.
An intuitive approach to minimizing cost of quality is to invest appropriately into prevention
which reduces failure cost.
The quality department is now broken into three groups, G1 who will work on quality
by design, G2 who will control quality and G3 who will improve quality, and the common goal
being to minimize cost of quality, and most importantly, cost of poor quality.
Quality Action Plan
Quality by Design
Quality by design is the art of designing a product that satisfies customers to the highest
extent. Quality by design in quality management and creating value* in marketing are very
similar, except that creating value emphasizes more towards the communication side and
quality management emphasizes more towards the delivering side. Quality by design can be
called as part two of creating value.
What exactly is the function of quality by design in a firm? Quality by design strengthens
three correlations:
- Creator's perception about customer's needs
- Expected product design and the actual design
- Design and the final product
when graphed on a scatter plot.
Quality by design works more towards preventing failures, rather than detecting and fixing
them, and as I said earlier, this reduces cost of quality and increases the customer base of the
firm.
Quality of design, is broken into five tasks, which we wil call as the 5 D's. The 5 D's
are:
- Define
- Discover
- Design
- Develop
- Deliver
Let us understand each of these points in detail.
Define
The firm begins by defining the base foundation of it's product, selecting it's
target market* and defining goals that are measurable.
The base-foundation for all industries are chosen by maximal area of expertise and
innovative base ideas that differentiate the product amongst competitive products in the same
area. For example, Zoho's CRM solutions and salesforce. Although the base ideas are the
same, Zoho did differentiate between salesforce and itself by adding new features. When it
comes to defining goals, both the service and manufacturing industries have a common list:
- Business figures
- Performance
- Customer loyalty
What is customer loyalty*? In professional terms, it is the retention capacity of a firm.
Discover
The firm must now understand the needs of the customer, provided the base foundation of the product and the target market. Which means, the design of the product is
a function of the customer needs and the base-foundation. Mathematically speaking,
Design = f(Base-foundation, Customer needs)
This makes the design of the product totally customer-centric. The design being customer centric alone is not sufficient, but the final product must be customer-centric too, which
requires processes to be customer-centric. This ensures customer-centricity in the firm, thus
embracing the first crumb of TQM.
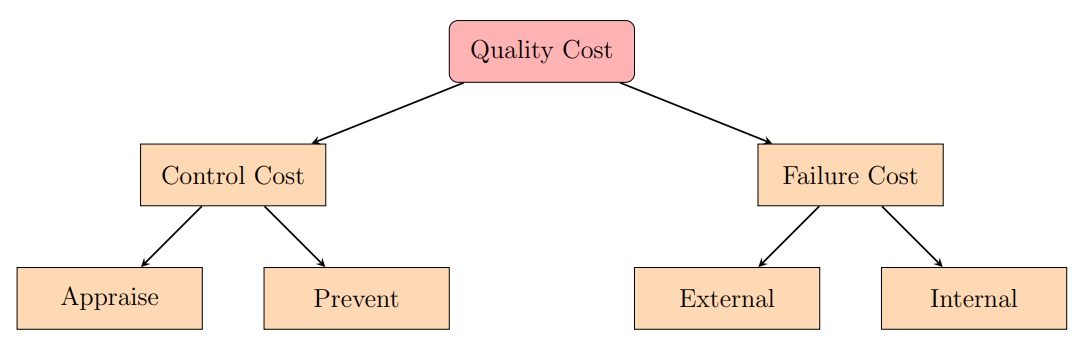
A very interesting philosophy is the Pareto principle. This principle states that a small
percentage of customers contribute to maximum revenue and the other large percentage
contributes little. We break these groups of consumers as the ”vital few” and the ”trivial
many”. In fact, this concept is not just applicable to customers, but also to root causes of
problems, products that are liked by consumers and many more. Subsequently, we have the
Pareto diagram, that helps the firm visualize the vital few and the trivial many. This tool is
pretty interesting, as it contains two graphs at once. The x-axis consists of attributes rather
than numbers and the left side of the y-axis is the frequency, and the attributes are arranged
in order, by the frequency count. While the right side is the cumulative percentage of total
occurrences per attribute. Here is an example:
Design
The data that has been collected must be converted into product jargons*, which
must then be converted into a product that satisfies maximum customers. This process of
converting customer needs into a design must be better that those of competitors in order
to outperform them. The firm must come up with creative ideas that please the customer.
The question that arises is, how can the firm outperform other firms? For that, the firm
holds analysis that reveals the features/ideas that other firms don't have and enforcing those
features into the design. Some methods of analysis are:
- Competitive assessment
- Evaluation of alternatives
In order for the design to be perfect, totally customer-centric, multiple design-reviews must
take place, the design must be looked at in a customer perspective, and this must be done by a set of people, not just one person, since the views may turn out to be biased. The design of
the product must be scalable, which means the construction of the design must be taken from
a general point of view, and not from a numerical point of view.
Development
A design is a visualization of the product, but to actually create the
product, the firm must begin the development process. The process should be developed in
such a way that:
- Requirements are satisfied
- Chronic waste is eliminated
- Defect-free controls are incorporated
When it comes to the software industry, the only point the firm requires to be satisfied is the
first one.
Delivery
This is the execution stage of the firm. We split this into two industries:
- Manufacturing
In this stage, the firm must make sure that the processes are actually
in production, and a scale-up strategy is implemented to increase production units.
- Service
In this stage, the firm must have well-trained human resource that can serve
the customers in a pleasing way. The hospitality of the service is like features of a
manufactured product, so the major players in the service industry are the front end
staff.
Quality Control
Quality control is the art of preventing problems and detecting problems that helps control
processes in ways that satisfies customers, pertaining loyalty. Preventing problems is generally
known as quality assurance. Quality control allows the firm to make sure that the product is
in the right hands and helps the firm maintain changes and processes in a controlled setting,
thus providing stability to the operational ability* of the firm.
Controlling the quality of a product is very important in order to understand consumer
behaviour.
From a control theory standpoint, prevention is a feedforward controller, while cure is
a feedback controller. Let us understand how the feedback controller works:
- The total quality of each aspect in a process is recorded. Total quality includes factors
such as completeness, time and etc.
- The recorded data is then sent into a controller which also knows the quality goals of
the firm.
- The controller then measures the expected performance and actual performance of each
aspect, and if there is a huge gap in between, it initiates an actuator (work of G2) and
positions the performance with the expected performance.
- These steps are repeated again and again, which maintains a good control over the
processes.
The overall feedback control process has two key steps:
- Identify the problem.
- Understanding the problem in detail, and thus solving the problem.
which we will be discussing in the coming texts.
To begin with, how does the firm measure the overall quality performance? Here is where
control charts come into picture.
Control charts are charts that allow the firm to keep standard deviations in control provided
the firm takes necessary actions to do so. Control charts have an upper control limit and a
lower control limit, and a systematic and healthy process is generally considered when the
data points are in between the control limits and get better and better when the data points
go towards the average line. How do we calculate the upper and lower limits? Assume that
we have a set of data points p1, p2, . . . , pn over equally spaced time limits t1, . . . , tn. We find
the standard deviation
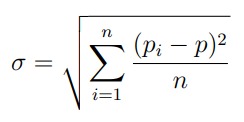
where p is the average of the data points (y co-ordinates). We divide the area between the
upper limit line and the average line (equation is y = p) into three different areas, each with
width σ. Similarly for the lower limit line, we divide the region into three different areas with
width σ. If, in the set of data points, a point pi
lies on the first level, it's generally good. If it
lies on the second level, it's not bad. If it lies on the third level, it's close to bad and if it
exceeds the three levels, there is a problem. The goal here should be to bring maximal data
points under the first two levels, and thus minimize future chances of data points exceeding
the upper or lower control limit line.
Let's understand this better with an example. Assume that you are a team of six working
for a project, and one week has elapsed. You want to find out if the work you are doing is
productive or not, so you want to do a control chart analysis. The data points are
(1, 45),(2, 50),(3, 20),(4, 80),(5, 15),(6, 66),(7, 81),(8, 90),(9, 10),(10, 39),
(11, 50),(12, 90),(13, 56),(14, 87),(15, 68),(16, 87),(17, 88),(18, 34),(19, 45),(20, 66)
We begin by calculating the mean, which is 58.35. And then we calculate the standard
deviation σ which turns out to be 25.36 and so our control limits:
I drew the LCL as 0 because negative LCL does not make sense.
The most important factor that we must take into consideration is that, the average working
hours of the team in those twenty days must be close to the expected average working hours for performance. Because, if the average working hours is 55, and everyone works together for
10 hours, with very little standard deviation, then the control chart won't show any error.
But that's an incorrect read, the working hours has been reduced by more than a quarter. So,
we conclude that the average line must be around the expected hours for performance.
So the basis of deciding the excellence of a process is just two points
- Gap between the average line and the expected performance.
- Control chart readings.
Once the firm knows that there is a problem in a particular aspect such as overtime, production
units and etc, by using control charts, the firm must understand the root cause of that problem
(moving on to the second step of the feedback control process), because once the root cause is
eradicated, there will not be much problems anymore. How can the firm find the root cause?
There are some methods of analysis:
- 5 Why's
- Cause and Effect Diagram
Let's understand each of these in detail:
5 Whys
The 5 Whys is a chain of ”why” questions linked with each other in order.
Here's an example that professor discussed:
- Albert failed the exam.
- Why? - Because he wasn't feeling well.
- Why? - Because he didn't sleep well.
- Why? - Because he had a headache.
- Why? - Because he rushed all the work in the end.
- Why? - Because he didn't prepare in a planned manner.
And so we have reached to the root cause of the problem. Conducting a 5 Whys analysis
seems trivial, but it actually is not, because going in a wrong direction of asking ”whys” shall
lead to inconclusive discussions. So how can a firm conduct a 5 Whys analysis? Here are the
steps:
Understand the problem
The most obvious step is to be crystal clear about what
the problem is. For example, loose screws in products, subsequently causing defects.
This must be seen by the analyst by his eyes so he is 100% clear about the problem.
Ask 5 Whys
The firm has identified the problem. The analyst must now ask 5 Whys
to the ground workers and labourers. Let us take the loose screws example:
- Products have loose screws.
- Why? - Because the labourers are in a hurry.
- Why? - Because there is a lot of work overload.
- Why? - Because the manager is overloading them with work.
- Why? - Because the senior manager is overloading the manager with work.
- Why? - Because there is no set process for managing the work.
And thus the root cause of the problem is reached.
Find a solution
Once the root cause is found, the entire team must work for finding
a solution to the problem, and discuss with the labourers directly their concerns and
opinions on this. If the firm subsequently employs a feedforward control mechanism,
then the poka yoke method, which doesnt allow the drill and the screw loose until the
screw is tight shall be an excellent preventive measure. But this doesn't mean the 5
Whys analysis is useless here, through the 5 Whys analysis the firm understand that
there is no set process for managing the work between the labourers. So, a combination
of feedforward and feedback controls shall provide operational excellence in the firm.
Sustain
One time solutions don't work. There should be a team that monitors the
operational excellence of that aspect, the example of discussion here being loose screws
so that such errors don't occur in the future.
Cause and effect diagram
This is essentially the 5 Whys analysis but in a more in-depth
and visual manner. Which means, the effect is divided into four major problems, and those
four major problems are further broken into smaller problems, and the 5 Whys analysis is
conducted into the small broken parts. So, the cause and effect diagram is a visual reduction
of the effect, and thus helps all the teams related to the subject of the effect, discuss and
come out with solutions and consistently monitor the processes, which shall eradicate the
root causes, thus completely solving the problem. Before getting into solving the problem,
the chains must be analysed to see if there are some logical mishaps, if there are none, the
firm is good to go. Here's a visual:
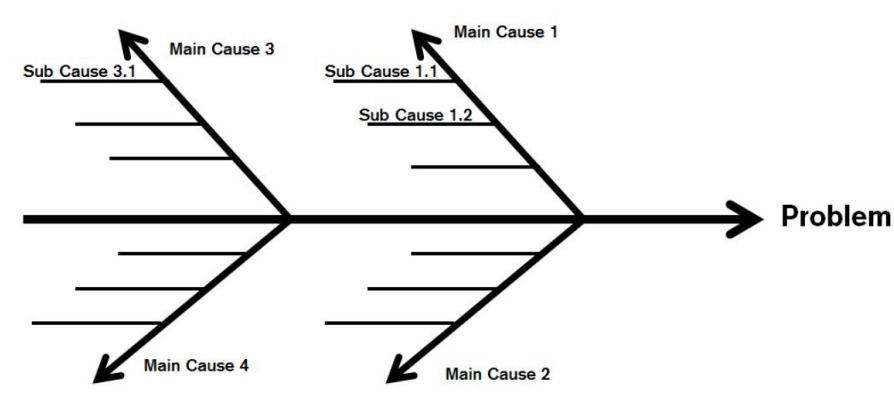
And of course, when the root causes of the major problems are reached, an action plan must
be designed to eradicate all those root causes, which will help the firm cherish, problem-free.
More problems shall come later, but this problem identifying and root cause identifying
analysis shall easily predict the problem, which means the firm must frequently conduct such
an analysis.
Quality Improvement
Quality improvement is the art of increasing operational excellence. Before we understand
what operational excellence is, let us understand what continuous improvement means.
Continuous improvement is the philosophy to continuously create and execute action plans in
ways that benefit the firm. This includes:
- Creating satisfactory products.
- Increasing productivity. Reducing defects.
On the other hand, operational excellence is a broader form of continuous improvement.
Operational excellence is achieved when each and every employee can identify the error in the processes and fix it. This requires high amounts of employee involvement, which means group
discussions between all hierarchies must be frequent.
What are the characteristics that must be embedded in a firm in order to achieve operational excellence?
The 10 core principles of operational excellence are:
- Treatment
All human parts of the firm must be treated with respect and without
bias.
- Employee Involvement
As discussed earlier, all employees must be given the right
to contribute to the table.
- Seek Perfection
As professor discussed, 99% is not enough, the firm must always aim
for a 100% perfection.
- Embrace scientific thinking
Scientific thinking involves
- Process Pessimism
The firm must always look at the worst aspect of the business
processes. If any fault occurs, the processes must be rigorously reviewed and the issues
must be identified.
- Immediate Reaction
The first step of the firm is to ensure quality in the first place.
If at all any error is found, then the reaction must be immediate.
- Continuity of flow
The flow of the processes must be uninterrupted, in order to
deliver high-quality products that satisfy the customer in real-time. If something is
interrupting the flow, it is considered as a waste. For example, if one machine stops
working, then that becomes a waste.
- Systematic approach
As discussed earlier, there must be quality-centric plans in the
firm in order to achieve business goals.
- Sustained purpose
The purpose of the firm must remain the same from the beginning,
and all the employees of the firm can work on the purpose foundation, and come out
with new ideas.
- Value for customer
Customer centricity, as discussed earlier, is the only reason
customers shall retain. Therefore the firm must create values as the customers wish.
We have some methods of increasing operational excellence, which are:
Let us understand each of these concepts in detail.
Lean
The term lean, which means fat-free, or in a more general term, waste-free, is
the process of eliminating waste through continuous improvement.
Let us understand this concept in three different areas:
- Lean manufacturing
- Lean services
- Lean software development
Lean manufacturing
Let us first understand the different kinds of waste:
- Overproduction
- Waiting
- Transport
- Poor process
- Inventory
- Unnecessary Movement
- Defects
- Unused creativity
Before the firm begins the production process, the marketing activities of the firm should
be able to predict the demand through mathematical tools such as regression and produce
products up to the forecasted result.
The time taken in the process must be minimized, so the process must be built in such
a way that the waiting time, that is the time taken for a machine or person to respond should
tend to zero. This process can be constructed by having sufficient backup plans, such as, extra machines in case a machine stops working, or purchase high quality machines.
Transporting the product from one place to another is a time waste, because it adds no
value to the product, in which sense, the time that is spent in transportation is a waste
for the product, because the product, before transporting is the same as the product after
transporting. This also applies to labourers and managers.
Processes are the heart of manufacturing. If the firm does not employ solid and systematic
processes, the firm cannot scale, make changes or do any of the things discussed above.
Excessive inventory is not only a waste, but it can be dangerous too, when the products
manufactured are expire-able, because they will waste money, more than time. Moreover,
inventory causes blockages in the supply chain, so the firm must adopt the Japanese ”zero
inventory” technique, which means, the products must be in motion, inventory is just like a
guest-house for them. How can we find out the size of the inventory? This is discussed in the
paper MBO in Investments, operational ability section.
Unnecessary movement for manpower can easily be eradicated if there are systematic processes
that tell the employees and labourers the tasks they are supposed to complete by the end of
the day. If the employees or labourers don't know what they're supposed to do, then they will
do something that is not necessary, for example help someone else in shifting items from one
place to another. Machinery movement can be eradicated if human movement is eradicated,
and for the automated machinery movement, the instructions must be pre-set, in order for it
to waste no time.
Defects can be reduced by taking preventive measures and proper inspection. As said
earlier, a mix of feedback and feedforward controls allow the firm to reduce defects to the
minimum.
Unused creativity is the idea or skillset which is not being used. It is considered as a
waste, because if that idea or skillset is employed, then the product can benefit, so in product
terms, it is considered a waste. This problem can easily be solved if there is proper employee
involvement.
Looking back at the whole discussion we had just now, what actually matters for the customer
here is high quality products delivered in minimal time. Another parameter that matters for
the firm is limitation of resources. Let us first discuss the customer's expectations.
We define flow time of an unit as the average time taken for it to be produced. Subsequently, we define expected flow time of an unit as the time that is required to keep up the customer's demand. As a consequence, the expected flow time (in hours) can be given by :
Working hours per day
Demand in that day
The flow time and expected flow time must not have a huge gap, and so the question is, what
must be the expected manpower? Let's pull some elementary math into this:
Assume that one labourer can reduce the time taken to produce a product from indefinite to
t. Then N such labourers can reduce the time to t/N. Let e denote the expected flow time.
Then, we must have
In order to achieve operational excellence, the current state of the product must be measured.
One tool for doing so is the current value stream map. This map documents everything going
on in the process from the supplier to the customer.
This map contains widgets, each widget specifying the process and various factors that
relate to the process. Those factors include:
- Time taken for that process
- Percentage defects for that process
- Process description
- Number of workers in that process
- Delay time
- Number of products produced within one shift
- Issues in the process
And the overall performance of all the processes:
- Cycle time
- Value added time
- Lead time
- Demand
- Expected flow time
- Total percentage defect
Finally, the satisfaction of customers is also recorded.
Subsequently, to improve the current state map, a future state map is constructed, which
automatically objectivizes the goals required to accomplish that future state map within
some time limit, because the widgets are already divided, and each step of the process is also
described, this allows the firm to understand the major reasons of the negative factors in
processes, and doing a 5 Whys and a cause and effect analysis shall reveal the root causes,
and a discussion for solving the root cause shall reveal the measures that are needed to be
taken, in order to increase overall quality.
More than removing waste, lean is about organizing the business. A very interesting technique
that businesses use is the 5S technique, which stand for
- Sort - eliminate unnecessary tasks, equipment, etc.
- Set in order - arrange the tasks in order, thus arranging the equipment based on the
tasks.
- Shine - keep the equipment clean, and moreover keep the processes required to successfully
execute the tasks clean.
- Standardize - create processes that organize the things discussed above.
- Sustain - maintain those processes.
When it comes to lean servicing, the parameters of measurement change, for example, production here would be successfully servicing a customer, delay time would be customer waiting
time and so on.
Lean software development
The major difference between lean manufacturing and
lean software development is that, in manufacturing, the products must be repeatedly produced, that too physically. But in software development, one application is enough, the rest
can be created into copies.
This does not imply lean software development is any easier than lean manufacturing, as there
are other barricades:
- Speed of functionalities
- Scalability
- Security
The code written for each functionality must be smart enough, so when executed, it takes
very little time. To do so, there are various techniques in coding, some being rearranging
pieces of code, some being introducing new variables which may seem unnecessary to the
untrained eye, some being intelligently rewriting the piece of code. The programmer does all
of this in order to reduce the time taken to execute the code.
After the product's release, the number of users using the product must be scalable, in
which sense, while constructing the product, the parameters used must be generic, and not
a fixed number. For example, if a product can hold a maximum of 100 users, then when
1000 users start using the product, the server shall be down, causing the users to not use the
product anymore.
Network security is very important in a software product. Hackers can do anything, hack the
application, which may cause great damage. To prevent network attacks, the product must
embed cryptographic algorithms such as RSA, ECC and etc.
Before I classify waste in the software industry, let me explain how the software industry flow
works:
The firm begins with the requirements of the product, which is designed from the customer
responses and mathematical methods such as linear programming*. Let us assume that
the requirements are r1, . . . , rn. Once these requirements are created, they are analyzed to
decide if those requirements are feasible or not. Once the final set of requirements r1, . . . , rk are finalized, the skeleton of the product is created, and finally the programmers code the
functionalities. Finally, after the product is made, it's tested, and compares the final product
to the expected product. If there are any issues, the cycle repeats itself, starting from the
analysis process. Subsequently, if the firm wants to update the software product, the process
remains the same, except that it's easier than doing whole products.
Looking back at the software cycle, we can classify waste as:
- Unclearity in requirements
- Extra time for completing a task
- Unnecessary code
- Job-free employees
- Unused creativity
- Time delay
- Poor processes
- Lack of learning new concepts
- Bugs
The very intriguing thing here is, suppliers are not even necessary. So, the value stream map
consists mainly of the processes and the customer satisfaction/feedbacks.
The major difference between the software and the manufacturing industry is that, software development has some elements of uncertainty, while manufacturing guarantees certainty.
This is because, visualizing a physical product is a lot easier than visualizing something
abstract. For example, the guarantee that the application is scalable itself is pretty abstract.
To ensure that the product will contain elements which can't be checked in a short-span of
time, lots of testing and learning should be done. Therefore, if any decision is made about
the product, the decision must be based on facts, and not abstract assumptions.
To speed up the process above, all the reading, learning, understanding must be done
in the analysis stage of the process. This shall allow the firm to be able to consistently flow
through the process, blocking any chances of ambiguity, thus reducing waste as much as possible.
Six sigma
The fundamental concept of six sigma is to place customer needs before anything,
even the business. Six sigma follow DMAIC protocols for improvement. DMAIC stands for:
- Define - be clear about the problem
- Measure - understand the level of performance and customer satisfaction.
- Analyze - find the root cause of the problem
- Improve - discuss and select appropriate solutions
- Control - check if the problem still exists and control accordingly
Applying six sigma to a process would result in just 3.4 defects over a million. Sigma stands
for standard deviation, and six sigma reduces the deviation from little to none. This is because,
in the control chart, 3σ is from the positive direction of the average line and −3σ from the
negative direction. Six sigma is thus a proven method for improving quality standards of a firm.
Six sigma looks at quality from a totally different perspective, thus allowing firms to rethink about their quality strategies. In conclusion, deploying six sigma strategies shall result
in
- Optimizing equipment cost
- Reducing time
- Reducing non-preventive costs
- More loyalty
Conclusion
Looking at quality from an amateurs eye may seem trivial, as in, quality may seem like
creating a product that is very good. But little does one know the entire process for achieving
quality. Quality, indeed is creating products that benefit both the firm and the customer, but
if that definition is professionalized, it can be looked as ”fitness for purpose”, breaking this
definition shall lead to areas that may not make sense unless connected in a systematic manner.
Summarizing the concepts discussed above, quality can be broken as follows:
- Quality Design
- Define
- Discover
- Design
- Develop
- Deliver
- Quality Control
- Control charts
- 5Whys
- Cause and Effect diagram
- Quality Improvement
- Lean management
- Six sigma
Operations
What is Operations Management?
Operations are the heart of a firm. Operations basically mean the mandatory tasks that a
firm must commit to, in order to provide salaries, satisfy shareholders and pay off debt. For
example, operations in a manufacturing firm would be production. Knowing operations, we
are now ready to formally define operations management
Definition of Operations Management
Operations management is the art of managing
operations through transformation processes in ways that keep the firm stable.
I would like to clarify two points here, firstly, stability of a firm stands for the ability of a
firm to reach its business goals. Secondly, transformation processes are process that convert
an input to a valuable output. The term valuable here is very important, because converting
inputs into garbage is not at all useful for the firm.
In order for the firm to be able to measure, and thus improve the operations, there should be
control over the quality of inputs, transformation processes and outputs. The vague solution
goes by introducing feedback controllers in every step, so the operations flowchart goes like
this:
Operations management basically manages this flowchart. We can split operations management
into two different sectors:
The operations in manufacturing can be broken into product design and inventory management while the operations in service can be broken into operations control and scheduling.
Overall, both industries contain process management, supply chain management,
resource planning and demand forecasting in their operations management exercise.
This is visually drawn in a flow chart below
Let us understand each of these points:
Manufacturing
- Product Design - converting the requirements, needs and specifications into a
manual for labourers.
- Inventory Management - keeping the inventory levels as low as possible, which
minimizes blockages in the supply chain.
Service
- Service Design - converting the requirements, needs and specifications into a manual
for customer-servers to follow.
- Waiting Management - managing the customer service allocation for all customers,
which means, reducing wait time.
Common
- Process Management - syncing business goals and processes in ways that keep the
customers satisfied.
- Resource Planning - minimizing usage of resources and allocating them in the most
beneficial manner.
- Supply Chain Management - managing the flow of goods or services from the origin
to the customer. Flows in services may include contracts and sub-contracts.
- Forecasting - ability to visualize business figures in future. Variations may occur,
resisting those variations come under process management.
Between any two processes or steps in a process, there are feedback controllers such as quality
controls that keep the variations between the business goals and the actual results in this
entire flowchart to the minimal. In order for the controls to be executed perfectly, continuous
analysis must take place. To learn more about feedback controls, refer to MBO in Product
Quality.
Detailed Action Plan
Product & Service Design
In order to come out with a design that satisfies maximal customers, the firm must first
understand the needs of the customers. For that purpose, we have various methods of collecting
data:
- Observational Research
- Ethnographic Research
- Questionnaires
- Qualitative Research
more details about these methods are discussed in MBO in Marketing. Back to the point,
using such methods of analysis, the firm can extract the customer's needs, which also involves converting responses and results derived from the analysis into product jargons and then
using modelling concepts such as linear programming that satisfies maximal customers. This
concept is very well known as creating value in marketing management.
While working on the product design, the firm must take some aspects into consideration:
- Reliability
- Robustness
- Degree of originality
Let us understand each of these points:
Reliability
Reliability is the measure of how well the product or service fits for the
prescribed purpose. This is basically a part of product quality, and reliability can be improved
by
- Testing
- User education
- Multiple design reviews
The reliability of the entire product is a function of the reliability of each functionality or
component in the product and the degree of user education, so in mathematical terms:
R(Product) = f(R(f1), . . . , R(fk), Degree of User-Education)
where R(t) denotes the reliability of component/functionality/product/service t.
In order to improve reliability of each functionality, the firm must conduct in-depth analysis
and measure the degree of excellence in every aspect of the product while designing the product
and the execution process. To learn more about this, visit MBO in Product Quality.
Robustness
Robust need not necessarily mean the strength of a physical item. Robustness
of a product is the ability of the product to be able to function in multiple states/conditions.
For example, consider two balms, one that only works for cough & cold and the other one
works for severe headaches, sprains, twists, fever, etc. The second balm is definitely more
robust than the first one, since it can be used in multiple states/conditions.
In the name of robustness if the needs of customers is sacrificed, then there is no point in keeping the product robust. Robustness must act like an extra layer of customer satisfaction, for example, customers would prefer a fragile phone with high features than a non-fragile
phone with lesser features.
A good example of products that continue keeping customers satisfied while being robust
is Tesla's truck. The windows are so strong that it would require three hammer hits to
successfully break it, but the aesthetics and features of the truck are well maintained.
Originality
If the firm is looking forward to improve an already existing product, for
example Samsung after iPhone, then the firm must conduct a multiple alternative analysis
to the pre-existing product to find the extra features that can be added which shall cause
diversion in customers. Pricing plays a very big role too, for example if Samsung priced it's
phones high, it wouldn't have gained the market share it has today.
Originality of the design can be tested by the percentage functionalities that are not existing
in the market up to date. Again, completely original products with low quality don't gain
any market share in the product, instead someone else copies the ideas, increases quality and
wins the market.
Inventory Management
To begin with, inventory is a place where manufactured goods ready to be sold are stored. Note
that there is a huge difference between inventories from the trade sector and the inventories
from the manufacturing sector. Inventory in the manufacturing sector can alternatively be
defined as the conjoining element between a sequence of processes that is broken into two
disjoint processes. So, when there is a gap between a sequence of processes, that is the sequence
is broken into two disjoint chains, the element that fills the gap is an inventory. While the
inventory in the trade sector is a warehouse where the products from the distributor are stocked.
Inventory in general is not a dump where products are stored. Inventory is a systematic
arrangement of goods that help the firm in
- Locating goods
- Minimizing physical risk and motion waste
- Coupling disjoint processes
- Controlling inflow and outflow of goods
We are now ready to formally define inventory management:
Definition of Inventory Management
Inventory management is the art of optimizing inventory costs, minimizing transportation cost and classifying inventory stock.
Let us understand each of the three points in the definition above in detail.
Optimizing inventory costs
Inventory cost consists of three different costs:
- Ordering cost - cost that is payed for ordering goods.
- Holding cost - cost that is payed for storing the goods, such as, depreciation, deflation,
taxes, spoilage, etc.
- Shortage cost - cost that is payed when an order is placed by the customer but there is
no stock in inventory.
The firm's key goal must be to minimize these costs. The first and foremost cost that must be
minimized is shortage costs. The other two costs don't make direct impact of the firm in the
market, while shortage costs may deduce customer retention rate. The second most important
cost is the holding cost. Storing too much of inventory is a phase of waste, especially for
expire-able products, since they have a deadline of usage. Most importantly, overloading of
inventory causes blockages in the supply chain, which is dangerous for the firm. The final and
the least important cost is the ordering cost.
Firstly, shortage cost should not exceed a penny. Secondly, holding cost must be minimized. That means, we can minimize both the shortage cost and holding cost by purchasing
goods that are equal to the customer demands. This way, maximal goods shall take part
in the supply chain, thus minimizing blockages. As professor showed us in the simulation
exercise, minimal inventory is better than inventory overload. We can thus mathematically
conclude that the reordering point would be when
Stock at point = Forecasted demand × Receiving time
and the reordering quantity would be
Reordering quantity = (Receiving time + gap) × Forecasted Demand + U
Here, receiving time is the time taken for the goods to enter the inventory. U here is the extra
goods required in case there are any variations in the forecasting (buffer stock), and we are
doing this because, shortage cost must equal zero. Finally, the gap is the number of days in
which the reordering point appears. It is best that gap is minimized, because variations in demand shall cause blockages which can be painful.
Minimizing transportation cost
Cost here includes both money and lead time. Lead
time is the time taken for goods to travel between two consecutive elements in the supply
chain. What we are trying to do here is to reduce transportation waste. To do so, we have a
mathematical model, which is known as the transportation model. Let us convert the general
transportation problem for monetary cost into mathematical terms:
Assume that there are m different ways of transport, t1, . . . , tm, n different destinations
d1, . . . , dn and distance D1, . . . , Dn and a total of T1, . . . , Tn goods to be transported to the
n destinations. Using transport ti has cost ci per mile and gi number of goods need to be
transported to destination di
, while the total capacity that ti can hold is Ci . The expressions
that we want to minimize are:
where oij is the number of times transport means tj has been used to reach destination di for all i. Another constraint we have for the above expression is that:
for all i because the transportation should be able to deliver all the goods successfully to the
respective destinations.
To reduce lead time, the best option is to do all of it simultaneously, because definitely
there will be enough trucks for transportation, and there is no use waiting for the truck to go
and come and send them for delivery again, since the cost is the same, but the time is getting
wasted. So the best solution for lead time reduction is to simultaneously deliver the goods to
all dealers.
Classifying inventory stock
Organizing inventory is one of the most important aspects when it comes to inventory management. Because if everything is messed up, then
it would be very difficult to identify the goods needed to be transported and it would take
hours to locate the product. Following the 5S principles shall allow the firm to organize the
inventory. The question that arises is, how does the firm know, which products are most
valuable and which are the least? For that we have two methods of analysis:
- ABC Analysis
- Movement Analysis
To learn more about these, visit MBO in Investments.
Let us now look at the visualization of inventory management:
Waiting Management
Waiting lines occur when there is an imbalance between supply and demand in timely terms.
If the servicemen are waiting for job, then there is less demand, more supply, whereas if
customers are waiting for their service, it is more demand less supply.
The costs that the firm will incur when there is an imbalance in demand and supply are:
- Waiting space cost
- Customer dissatisfaction
- Salary waste
- Loss in customers
When it comes to services, the supply of manpower that service customers is dependent on
- Forecasted customer demand
- Working hours
- Difficulty of tasks
Working hours
Manpower = f(Demand,Working Hours, Difficulty)
Basically, the capacity of the firm is inversely related to the customer waiting time. Similarly,
the demand of the customers is inversely related to salary waste. I am using the term related
and not proportional because proportional follows equivalent ratios, while relations necessarily
don't. Before I determine what exactly (or at least approximately) f is, let us understand
some concepts.
First, we understand the characteristics of waiting lines:
- Channelization
- Queuing Order
Channelization is basically the process of distributing customers arriving for one purpose into
different channels, while queuing order is the discipline that is followed for servicing customers.
A very common and intuitive discipline is the ”first come, first serve” basis.
We now define customer arrival and service rates:
- Arrival Rate - the rate in which customers arrive in every unit of timely measurement
per channel.
- Service Rate - the rate in which customers are serviced in every unit of measurement
per channel.
These two rates shall be denoted by µ and λ respectively. Before going any further, here are
some results:
- Customers Served - The average customers that are being served is
- Customers Served per channel - The average customers that are being served per
channel is
Waiting Time
Assume that the timely measurement is t hours and µ is the arrival
rate in the timely measurement t. That means, on average, a new customer comes in
every t/µ hours. If
where st is the servicing time per channel (in hours), then the waiting time is zero. So,
assume that
Then, the amount of time the nth customer waits is
hours per channel. If the number of channels is C, then the wait time reduces to
Expected Probability of Number
The expected probability that there are n
customers in the waiting line in average per channel is
P(n customers in waiting line) =
That's because,
P(n customers in waiting line) = P(n − 1 customers in waiting line)
and the expected probability that no one is in the waiting line is given by
Expected Customers in line
We know that the expected probability of n customers
being in line is
So, if the expected number of customers in line is Ec, then,
so Ec is a solution to the discrete logarithm above. We can better rewrite it as:
Before I approximate the function f, we understand that for each service si
in the firm, the total manpower is C, the number of channels.
We are now ready to explicitly define f:
Let µi denote the arrival rate per channel for service si and λi be that of service rate with timely measurement t. Then,
where t(.) is the time function in hours and w is the working hours. The 60/13 came because each customer cannot wait for more than thirteen minutes, which means that the final customer in
each channel should get a maximum of thirteen minutes in waiting time. Therefore, we set
n = Ec and W(t,Ec) = 13. The last step follows because services are generally open for ten hours.
An interesting fact is that,
λ = f(µ, channels)
which derives itself trivially from the equations above.
A very natural question that arises is, how can we calculate λi and µi? Before I proceed, let me introduce you to the notion of poisson distribution.
Poisson distribution determines the probability of a situation occurring x times which suits
our problem of calculating λi and µi. In order to effectively evaluate these values, some
amount of data is required to perform this act.
Consider a sample containing discrete data. If the curve of that sample is a function f,
then the poisson distribution of that curve is the point x on the curve such that
where ρ = E[x] = Var(x), which means that ρ is the expected value of x such that it equals
it's variance.
Applying this on the samples of arrival and service rates in timely measurement t shall
give us the rate in which customers arrive in timely measurement t and the rate in which they
are serviced.
Forecasting
Forecasting in the context of economics is the process of cultivating supply appropriately that
keeps the supply chain healthy. Which means, there are no blockages, or shortages.
Forecasting is a concept that relies on three things:
- Data
- Mathematics
- Approximations
Which can be mathematically represented as
Forecasting = f(Data, Mathematics, Approximations)
Taking back a look at the waiting management section, this actually makes sense, because to
evaluate the λi and µi, we needed data, of course there was immense mathematical touches
and most importantly, we were not super accurate with the model, and we can't be, because of
the unpredictability in the behaviour of arrival rates. Although service rates can be controlled,
because it's based on the firm, arrival surely is a lot less controllable than the service rate.
Forecasting can be successful if and only if, the customer inputs are converted into an
output, which means, the consumer behaviour and responses should be converted into a
superior product with high quality measures. Converting customer inputs into an output is
basically the crux of marketing management, so this section will enforce a lot of marketing
concepts.
The most important aspect of all aspects in forecasting is the observational data that the firm
has, in which sense, the data available about consumers on other firms. A combination of
observational data and customer responses from appropriate questionnaires shall reveal the
problem that consumers are facing, and a vague figure of the demand that shall arise, for example high, medial and low.
To come out with more accurate figures, the firm must measure customer responses by
the most challenging problem they are facing, for example, scrolling down to the bottom of
a page on button phones. Another important fact that must be taken into consideration is
that when a consumer invests his time into answering the firm's questionnaire, he has some
genuine interest towards the firm.
Now the excitement and enthusiasm of the questionnaires responses shall be categorized
into three:
Assume that h are highly enthusiastic responses, m are medially enthusiastic responses and l
have a low level of enthusiasm. If the marketing and quality combination is done very well,
then those h customers shall be the first to purchase the product at it's release. The next
question that arises is, how many of the m + l customers shall purchase the product? In order
to answer that, more questionnaires should be released to samples asking them about their
expressions about products of other firms when those firms sent them a set of questionnaires
regarding their product. Sample size shall be selected through concepts in sampling theory
which shall not be discussed here. When a set of a customers react to medial and b of those
purchased the product, then b/a of the medial customers bought the product, while in the low category, d/c
bought the product. Circulating such questionnaires to samples about different
firms shall yield the percentage of medial and low customers that actually bought the product.
Taking the poisson distribution shall tell the firm the two percentage rates α and β of medial
and low customers respectively who bought the product after it's release. So, the demand
estimate would be
and thus the demand is forecasted.
Note that this is a very simple model presented above, complicated models require gritty
estimates which shall not be discussed in this article.
Process Management
Process management is the art of managing processes in ways that meet demand after
successful forecasting of it. There are three types of processes:
- Senior Processes
- Core Processes
- Supportive Processes
Senior processes are processes that govern and control the core processes and strategies in
ways that keep the deviations in statistical business figures under control.
Core processes are the processes that actually convert inputs into valuable outputs. These
processes can be considered as transformation processes.
Supportive processes are processes that assist the core processes, for example, parallel subprocesses in the chain of core processes
The goal of the firm should be managing these three processes in ways that meet profitability and consequently demand. Senior processes should be very efficient and quick in
reaction. Most senior processes abide decentralized management rules, which is the purpose
of MBO.
Core processes should pertain a customer-centric design, which can be done by enforcing
quality principles. There are three aspects when it comes to core processes:
- Process Design
- Process Improvement
- Process Control
Let us understand these aspects in detail:
Process Design
This is the first step of the core process. Before designing a process,
the firm must address a few questions:
- What do we need?
- Why do we need?
- Who do we need?
The first question is in regard with the aspect that is lagging in the firm. For example, a car
manufacturer lags windshields. The second question is in regard with the reason of that need.
In the windshields situation, windshields are mandatory, because if it rains then drivers won't
be able to see clearly. Finally, the third question is in regard with the set of ground workers
who shall execute the task.
When these questions are addressed, we ask this set of questions again. Which means,
in order to successfully attach the windshield in the car, the questions are asked once more,
what do we need, why do we need and who do we need. These questions are asked step by
step until the entire design is very clear.
Designing requires high level of organization, after each set of questions, the needs should be
arranged in order, so when we reach the final needs, where no more questions can be asked,
the entire process design is in order. Here is the example of the ”what do we need” for a car
windshield:
And so the root needs are reached and organized. Another important fact that we must
consider is that, when I put '+' between two non-machinery attributes, it means there is
another machine that assembles them together. So for the motor leaf, between wires and
frame design, there is a second machine that puts them together. Finally, all the three nodes,
wiper, motor and pivot are all assembled together to make a windshield.
This means, under a node, if there are n non-machinery attributes, there should be at least
one more machine that combines those child-nodes together to make the parent node successful.
Drawing the design in the form of a flow chart always helps, because it gives a very good
visual. Designing core processes are not the job of one man or one group. It requires the
whole organization to work towards it.
I have also discussed the notion of supportive processes above, the process that is subdesigned under the core process that assembles more than one non-machinery attribute is
called as a supportive process. Supportive processes can also be called as parallel dependent
processes.
Process Control
The efficiency and effectivity of the process should be measurable,
in which sense, there should be benchmarks which can point the level of process quality.
A vague picture of the measure in quality of processes can easily be figured out while
proofreading the output. But the major challenge is to figure out the exact process and aspect
that is getting out of control. In order to measure that, we have some techniques
- Control Charts
- 5 Whys
- Cause and Effect Diagram
Control charts are a pictorial representation of variations in the process. Control charts
contain two limit lines, the UCL and LCL. If an attribute exceeds the control limits, then
that attribute requires serious care, else we are good to go.
5 Whys analysis is a singular approach to to understanding the root cause of the problem by repeatedly asking 5 Whys. The answer you get in the end is the root cause.
Cause and Effect diagram is a multilingual approach to finding out all the root causes
of an effect. Each and every aspect is discussed in detail in this analysis, unlike the 5 Whys
which only goes to the root causes and does not understand the entire context behind it.
In contrast, process controls are a form of feedback and feedforward controllers, feedback
controllers being taking action after the effect and feedforward controllers being taking action
before the effect.
Investing on feedforward controllers is a lot more beneficial than investing on feedback
controllers, because the effect doesnt even happen!
Process Improvement
Process improvement is equivalent to quality improvement. I
am adding the texts of MBO in Product Quality on the Quality Improvement section
here.
Continuous improvement is the philosophy to continuously create and execute action plans in
ways that benefit the firm. This includes:
- Creating satisfactory products.
- Increasing productivity. Reducing defects.
On the other hand, operational excellence is a broader form of continuous improvement.
Operational excellence is achieved when each and every employee can identify the error in the
processes and fix it. This requires high amounts of employee involvement, which means group
discussions between all hierarchies must be frequent.
What are the characteristics that must be embedded in a firm in order to achieve operational excellence?
The 10 core principles of operational excellence are:
- Treatment
All human parts of the firm must be treated with respect and without
bias.
- Employee Involvement
As discussed earlier, all employees must be given the right
to contribute to the table.
- Seek Perfection
As professor discussed, 99% is not enough, the firm must always aim
for a 100% perfection.
- Embrace scientific thinking
Scientific thinking involves
- Process Pessimism
The firm must always look at the worst aspect of the business
processes. If any fault occurs, the processes must be rigorously reviewed and the issues
must be identified.
- Immediate Reaction
The first step of the firm is to ensure quality in the first place.
If at all any error is found, then the reaction must be immediate.
- Continuity of flow
The flow of the processes must be uninterrupted, in order to
deliver high-quality products that satisfy the customer in real-time. If something is
interrupting the flow, it is considered as a waste. For example, if one machine stops
working, then that becomes a waste.
- Systematic approach
As discussed earlier, there must be quality-centric plans in the
firm in order to achieve business goals.
- Sustained purpose
The purpose of the firm must remain the same from the beginning,
and all the employees of the firm can work on the purpose foundation, and come out
with new ideas.
- Value for customer
Customer centricity, as discussed earlier, is the only reason
customers shall retain. Therefore the firm must create values as the customers wish.
We have some methods of increasing operational excellence, which are:
Lean
The term lean, which means fat-free, or in a more general term, waste-free, is the
process of eliminating waste through continuous improvement.
Let us understand this concept in three different areas:
- Lean manufacturing
- Lean services
- Lean software development
Lean manufacturing
Let us first understand the different kinds of waste:
- Overproduction
- Waiting
- Transport
- Poor process
- Inventory
- Unnecessary Movement
- Defects
- Unused creativity
Before the firm begins the production process, the marketing activities of the firm should
be able to predict the demand through mathematical tools such as regression and produce
products up to the forecasted result.
The time taken in the process must be minimized, so the process must be built in such
a way that the waiting time, that is the time taken for a machine or person to respond should
tend to zero. This process can be constructed by having sufficient backup plans, such as,
extra machines in case a machine stops working, or purchase high quality machines.
Transporting the product from one place to another is a time waste, because it adds no
value to the product, in which sense, the time that is spent in transportation is a waste
for the product, because the product, before transporting is the same as the product after
transporting. This also applies to labourers and managers.
Processes are the heart of manufacturing. If the firm does not employ solid and systematic
processes, the firm cannot scale, make changes or do any of the things discussed above.
Excessive inventory is not only a waste, but it can be dangerous too, when the products
manufactured are expire-able, because they will waste money, more than time. Moreover,
inventory causes blockages in the supply chain, so the firm must adopt the Japanese ”zero
inventory” technique, which means, the products must be in motion, inventory is just like a
guest-house for them. How can we find out the size of the inventory? This is discussed in the
paper MBO in Investments, operational ability section.
Unnecessary movement for manpower can easily be eradicated if there are systematic processes
that tell the employees and labourers the tasks they are supposed to complete by the end of
the day. If the employees or labourers don't know what they're supposed to do, then they will
do something that is not necessary, for example help someone else in shifting items from one
place to another. Machinery movement can be eradicated if human movement is eradicated,
and for the automated machinery movement, the instructions must be pre-set, in order for it
to waste no time.
Defects can be reduced by taking preventive measures and proper inspection. As said
earlier, a mix of feedback and feedforward controls allow the firm to reduce defects to the
minimum.
Unused creativity is the idea or skillset which is not being used. It is considered as a
waste, because if that idea or skillset is employed, then the product can benefit, so in product
terms, it is considered a waste. This problem can easily be solved if there is proper employee
involvement.
Looking back at the whole discussion we had just now, what actually matters for the customer
here is high quality products delivered in minimal time. Another parameter that matters for
the firm is limitation of resources. Let us first discuss the customer's expectations.
We define flow time of an unit as the average time taken for it to be produced. Subsequently, we define expected flow time of an unit as the time that is required to keep up with
the customer's demand. As a consequence, the expected flow time (in hours) can be given by :
Working hours per day
Demand in that day
The flow time and expected flow time must not have a huge gap, and so the question is, what
must be the expected manpower? Let's pull some elementary math into this:
Assume that one labourer can reduce the time taken to produce a product from indefinite to
t. Then N such labourers can reduce the time to t/N
. Let e denote the expected flow time.
Then, we must have
In order to achieve operational excellence, the current state of the product must be measured.
One tool for doing so is the current value stream map, which visualizes the entire process.
Subsequently, to improve the current state map, a future state map is constructed, which
automatically objectivizes the goals required to accomplish that future state map within
some time limit, because the widgets are already divided, and each step of the process is also
described, this allows the firm to understand the major reasons of the negative factors in
processes, and doing a 5 Whys and a cause and effect analysis shall reveal the root causes,
and a discussion for solving the root cause shall reveal the measures that are needed to be
taken, in order to increase overall quality.
More than removing waste, lean is about organizing the business. A very interesting technique
that businesses use is the 5S technique, which stand for
- Sort - eliminate unnecessary tasks, equipment, etc.
- Set in order - arrange the tasks in order, thus arranging the equipment based on the
tasks.
- Shine - keep the equipment clean, and moreover keep the processes required to successfully
execute the tasks clean.
- Standardize - create processes that organize the things discussed above.
- Sustain - maintain those processes.
When it comes to lean servicing, the parameters of measurement change, for example, production here would be successfully servicing a customer, delay time would be customer waiting
time and so on.
Lean software development
The major difference between lean manufacturing and
lean software development is that, in manufacturing, the products must be repeatedly produced, that too physically. But in software development, one application is enough, the rest
can be created into copies.
This does not imply lean software development is any easier than lean manufacturing, as there
are other barricades:
- Speed of functionalities
- Scalability
- Security
Before I classify waste in the software industry, let me explain how the software industry flow
works:
Looking back at the software cycle, we can classify waste as:
- Unclearity in requirements
- Extra time for completing a task
- Unnecessary code
- Job-free employees
- Unused creativity
- Time delay
- Poor processes
- Lack of learning new concepts
- Bugs
The very intriguing thing here is, suppliers are not even necessary. So, the value stream
map consists mainly of the processes and the customer satisfaction/feedbacks. Six sigma.
The fundamental concept of six sigma is to place customer needs before anything, even the
business. Six sigma follow DMAIC protocols for improvement. DMAIC stands for:
- Define - be clear about the problem
- Measure - understand the level of performance and customer satisfaction.
- Analyze - find the root cause of the problem
- Improve - discuss and select appropriate solutions
- Control - check if the problem still exists and control accordingly
Applying six sigma to a process would result in just 3.4 defects over a million. Sigma stands
for standard deviation, and six sigma reduces the deviation from little to none. This is because,
in the control chart, 3σ is from the positive direction of the average line and −3σ from the
negative direction. Six sigma is thus a proven method for improving quality standards of a firm.
Six sigma looks at quality from a totally different perspective, thus allowing firms to rethink about their quality strategies. In conclusion, deploying six sigma strategies shall result
in
- Optimizing equipment cost
- Reducing time
- Reducing non-preventive costs
- More loyalty
A lot of the concepts discussed here are highlighted. To learn these concepts in detail, please
visit MBO in Product Quality.
A problem that firms face is process variation. Process variation occurs when the design of
the process, which is dependent on the forecasted demand varies from the actual requirements
and customer demand. Variation can occur in four different sources:
- Forecasting
- Assignable
- Variety
- Buffer
Forecasting variation occurs when the forecasted demand and the actual demand are pretty
far. This can cause either blockages or shortages. In order to prevent forecasting variation,
observational and ethnographic research must take place.
Assignable variation is when the inputs are defective, causing the process control to shake.
Preventing this variation requires a feedback controller which verifies the quality of inputs
and rejects inputs if they are defective. Of course, this requires a machine as well.
Variety variation occurs when there are too many requirements in products and services. This
variation can be eradicated if the 5S principles are incorporated in organizing the tasks and
requirements.
Buffer variation is the variation that cannot be completely eradicated. In order to minimize this buffer variation, the entire burden goes towards the processes themselves, so quality
improvement techniques must be implied towards processes.
Resource Planning
Resource planning is the art of identifying, organizing and minimizing resources in ways that
satisfy the needs of the firm and the forecasted demand.
Identifying resource needs is known as material requirements planning or MRP 1. This
concept has already been discussed above in the process design section, where we consider
the product structure tree and go to the root needs of the product. Organizing resource
needs has also been discussed in the product structure tree, where we align the needs of each
requirement in order and have a machine that assembles two or more non-machinery resource
needs.
What is left to be discussed in resource planning is minimizing the resource needed. For
this purpose, we have some models which work in optimizing cost. The first model is the assignment model. Assume that there are r resources a1, . . . , ar and n tasks b1, . . . , bn and the cost of using resource ai in task bj is cij for all 1 ≤ i ≤ r and 1 ≤ j ≤ n.
What we want to minimize is the expression:
Where εij = 1 if resource ai is used in task bj and 0 otherwise.
Note that this assignment model requires the tasks to be flexible, in which sense, any
of the resources can be used in those tasks. For example, creating a wiper and creating a
motor for the windshield are two inflexible tasks while creating a wiper and a stylish wiper
are flexible, because what matters is the frame and the design can be coded into a computer
program.
In the name of optimizing resources, quality should not be sacrificed. In a set of flexible tasks, the resources offered should be over a buffer quality limit. Now the question is,
what if a resource is slightly high in cost of a resource which is much lower in quality but is
at least the expected quality limit? Of course, the resource which is much higher in quality
and slightly higher in cost is a lot more worth than the other resource. In this case, we are
only losing. The assignment model fails in this case. The solution to this problem is to create
a measurement function f, which when inputted any particular resource gives an output
as a numerical measurement. Coming out with such a function requires huge knowledge in
mathematical modelling, as there are various parameters to be measured which is definitely,
rocket science and hence is omitted in this article. Assume that we have such a measurement
function f which gives us quality measures of the resource. In that case, the expression we
will be minimizing is
Supply Chain Management
When a manufacturing firm comes out with a super-high quality product, the firm expects
equivalent profits for their work. But coming out with a high quality product and staying idle
never works. In fact, totally managing the firm itself wouldn't lead to much profitability. What
matters here is if the super-high quality product has landed on the hands of the customer
properly or not. This requires managing the entire supply chain point-to-point, including the
firm itself.
As I said earlier, supply chains are chains that visualize products moving from one firm
to another until it lands on the hands of the customer, we also looked at how to eradicate
blockages and shortages, which keep the supply chain healthy.
But supply chain management isnt just knowing what goes where, when and how. Supply chain management is the process of managing every aspect in firms in the supply chain,
point-to-point.
The internal customers of the manufacturing firms are the point-to-point firms which belong
to the supply chain.
There are three components when it comes to supply chain management:
- Conformance
- Relationships
- Inventory Management
Conformance is the process of guaranteeing that the required products and number are reached
to the desired firm on a point-to-point basis.
Supply chain relationships are the relationships between point-to-point firms in the supply chain, which when is strengthened can cause profitability to all the firms in the chain.
Inventory management, as discussed earlier, is the art of optimizing inventory levels for
all the firms. This is surely a difficult task, because the chain must flow from the first point
(manufacturing firm) to the last point without blockages or shortages. Looking properly at
this, one can realize that with proper time management, inventory levels can be minimized
for all the firms.
This looks pretty intuitive, because in a chain, there are three components:
- Widgets - Inventory Management
- Connections - Supply Chain Relationships
- Flow - Conformance
Conformance can be guaranteed through models like the transportation model in addition to
some machinery which looks out for defective products at it's arrival.
Supply chain relationships should be strengthened, in which sense, there should be no
delay in arrival of goods, often discussions between point-to-point firms and etc. This keeps
the internal customers satisfied, and their satisfaction is reflected on the customer's face.
In the information era, supply chain management has incorporated a concept called IOIS.
IOIS, which stands for Interorganizational Information System is a system that uses information technology to overcome physical difficulty in informing. Basically, IOIS is a software
technology that automates conformance and inventory management between point-to-point
firms in the chain. IOIS consists of five levels of participation:
- Remote I/O node - This creates point-to-point interactions between firms and a sensor
on the local I/O enables actuators to begin the processing.
- Application processing node - This takes into consideration the details given by consecutive firms for packaging and delivery, and executes the task as needed.
- Multi-participant exchange node - This is a degree addition of the previous node. This
node enables multi application processing, from one point to different low-level points.
- Network control node - This node automates maintenance of inventory levels, figures out
potential errors in the network and fixes them, so it is basically a feedback controller.
- Integrating network node - This node allows other firms to integrate themselves in the
supply chain, yet keeps the entire processes above stable and secure.
Conclusion
Operations management has been one of those concepts where knowledge comes from experience and not from literature. A lot of topics (which aren't included here) cannot be explained
in simple words, they require real-time experiences. While what can be explained in words is
the top layer of operations management and a overview of each of the concepts in detailed.
There are six different aspects when it comes to operations management, four of which are
common and two of which are specific. So, we have six groups of people working together in
each sector, call the Gi
for all 1 ≤ i ≤ 6.
The overall objectives thus are:
Product Design or Service Design
- Reliability
- Robustness
- Originality
Originality
- Optimizing inventory costs
- Minimizing transportation costs
- Classifying inventory stock
Waiting Management
- Reduce salary waste
- Reduce wait time
Forecasting
- Response measuring
- Observational & Ethnographical research
Process Management
- Senior processes
- Core & Supportive processes
- Process design
- Process control
- Process improvement
Resource Planning
- Optimize resources
- Materials resource planning
Supply Chain Management
- Conformance
- Relationships
- Inventory Management
- Using IOIS